Biology
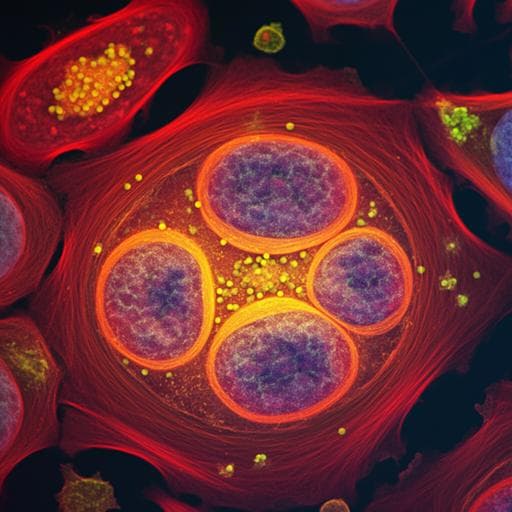
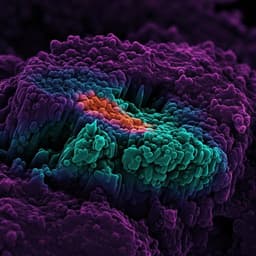
High-dimensional super-resolution imaging reveals heterogeneity and dynamics of subcellular lipid membranes
K. Zhanghao, W. Liu, et al.
Discover the groundbreaking Spectrum and Polarization Optical Tomography (SPOT) technique developed by researchers including Karl Zhanghao and Wenhui Liu, which allows for real-time monitoring of subcellular lipid dynamics in live cells. This innovative method provides insights into lipid heterogeneities during cell division across multiple organelles.
~3 min • Beginner • English
Introduction
Lipid membranes surround most subcellular compartments and are heterogeneous in morphology, composition, and phase, which together regulate membrane biophysics, protein function, and organelle coordination. However, in vivo approaches to study membrane heterogeneity dynamically with high spatiotemporal resolution and throughput have been limited. The authors aim to enable super-resolution, live-cell mapping of membrane morphology, polarity, and phase simultaneously using a single, broadly applicable dye. They leverage Nile Red, which universally stains intracellular lipid membranes, and exploit two physical readouts: its polarity-sensitive emission spectrum (red-shifts in polar environments, blue-shifts in nonpolar) and polarization-resolved wobbling dynamics indicative of lipid order. The research question is whether a high-throughput optical method combining spectral ratiometry and polarization modulation with optical sectioning can accurately resolve lipid heterogeneity across and within organelles and monitor dynamic lipid rearrangements in live cells.
Literature Review
Prior studies typically measured either lipid polarity or lipid phase alone. Fluorescence polarization microscopy (e.g., two-photon linear dichroism and polarimetry) can map molecular order but often requires point scanning or specialized hardware, limiting speed and throughput. Spinning-disk polarization microscopy improves speed but remains slower and less accessible. Polarization demodulation can achieve super-resolution under sparse orientational distributions, which is not generally satisfied in crowded cellular membranes. Single-molecule localization microscopy can measure dipole orientation and wobbling but requires ultra-low dye concentrations incompatible with universal membrane labeling. Mass spectrometry-based lipidomics quantifies composition but is unsuitable for live-cell spatially resolved dynamics. Thus, there is a need for a correlative approach that simultaneously quantifies membrane polarity and phase in live cells at high spatiotemporal resolution and throughput.
Methodology
Technique: SPOT (Spectrum and Polarization Optical Tomography) combines structured illumination-based optical sectioning with spectral ratiometry and polarization modulation to extract morphology, polarity, and phase using a single dye (Nile Red). Six raw images are acquired per dataset using structured illumination patterns: three stripe directions each with two phase shifts (π phase shift). HiLo fusion is applied per direction to reject out-of-focus background, yielding three optically sectioned images under polarization modulation, enabling accurate polarization analysis with fewer images than SIM. SPOT can process SIM datasets (SPOT-SIM3D) to leverage doubled lateral resolution. Measurements: Polarity is quantified by an emission ratio using two detection bands (e.g., red/green channels upon 561 nm excitation). Lipid phase/order is inferred from polarization modulation depth derived from the three polarization-modulated images by computing ±1st harmonics along the polarization dimension (dipole wobbling more restricted in ordered membranes yields higher modulation depth). Dipole orientation can also be estimated. Sample preparation: Live U2-OS cells were labeled with 1 µg/ml Nile Red 1 h before imaging and during imaging. For organelle identification, cells were transfected with GFP markers (Rab5a early endosome, Rab7a late endosome, ER-GFP, Golgi-GFP, Lamp1 lysosome, mitochondria-GFP). Fixed-cell controls used Alexa Fluor 568 phalloidin to validate SPOT accuracy. Imaging system: Home-built SIM with 488 and 561 nm lasers, SLM-generated stripes, polarization-controlled ±1 diffraction orders, NA 1.49 objective, four-way splitter for spectral channels (blue 417–471 nm, green 505–545 nm, yellow 578–614 nm, red 658–749 nm) on an sCMOS camera. SPOT acquisitions used 561 nm excitation and yellow/red detection for Nile Red; for colocalization, sequential 488/561 excitation with green/yellow/red detection. A commercial 3D-SIM (OMX) was also used for high-resolution datasets. Calibration: Illumination nonuniformity was corrected using 100 nm fluorescent beads; spectral channel registration performed via fiducial-based affine transforms. Data processing: Channel splitting and registration; HiLo optical sectioning with weight factor a=1; SPOT intensity image obtained by averaging the three sectioned images; emission ratio computed as red/green; modulation depth and dipole orientation computed from polarization-modulated images. Accuracy analysis: Simulations of two nearby fluorophores with distinct spectra and dipole behaviors showed that doubling lateral and axial resolution reduces mapping errors from 15.1% to 2.2% (polarity), 45.5% to 7.9% (phase), and 19.1% to 1.6% (orientation). Experimental validation using AF568-labeled actin as ground truth demonstrated SPOT increased accuracy from 71% to 95% for emission ratio vs WF, from 62% to 91% for modulation depth, and from 87% to 96% for dipole orientation vs WF and SIM. Acquisition speed and photostability: Each raw image exposure was 40 ms; a SPOT dataset (six images) took 240 ms. Long-term imaging achieved non-bleaching operation at 0.33 Hz over 10 minutes. Statistical analysis: Organelle measurements were made along manually drawn polylines; repeated acquisitions ensured modulation depth stability (<15% fluctuation). Group comparisons used unpaired two-tailed t-tests (p<0.05) and one-way ANOVA with Duncan’s multiple range test for multiple groups.
Key Findings
- SPOT provides high-dimensional maps: intensity (morphology), emission ratio (polarity), and polarization modulation depth (phase/order) with optical sectioning and improved measurement accuracy compared to WF and SIM alone. Simulations showed error reductions from 15.1% to 2.2% (polarity), 45.5% to 7.9% (phase), and 19.1% to 1.6% (orientation) with doubled spatial resolution. Experimental validations increased accuracies from 71% to 95% (emission ratio), 62% to 91% (modulation depth), and 87% to 96% (dipole orientation).
- Organelle-level lipid heterogeneity (n=24 per organelle) revealed distinct polarity and phase across compartments (plasma membrane, nuclear membrane, ER, mitochondria, lipid droplets, Golgi, lysosome, endosome). Nuclear membrane and ER: highest emission ratios (high polarity) and relatively high modulation depth. Plasma membrane and early endosome: low emission ratio and highest modulation depth (high order). Lipid droplets: lowest emission ratio and lowest modulation depth (low polarity and disorder). Compartments clustered into six groups on a polarity–phase plot.
- Intra-organelle heterogeneity: In mitochondria, cristae exhibited significantly higher lipid polarity than the outer membrane (p=0.0118) while phase showed no significant difference (p=0.4265; n=24 mitochondria), consistent with known differences in cholesterol content between outer membrane and cristae. In large lipid droplets, both emission ratio and modulation depth were smaller in the core than the shell, consistent with neutral lipid cores coated by phospholipid monolayers.
- Dynamic changes during endosome maturation: Colocalization with Rab5a-GFP and Rab7a-GFP showed an increase in polarity and a decrease in phase from early to late endosomes (n=24 each; p<0.0001 for both), aligning with reduced cholesterol/sphingolipid content during maturation and convergence toward lysosomal properties. Lipid droplet maturation showed decreasing emission ratio with growth (more neutral lipid storage).
- Cytokinesis dynamics (time-lapse at 0.33 Hz over 10 min): During plasma membrane separation, emission ratio decreased (lower polarity) while modulation depth increased (higher order), then both recovered post-division; a control membrane remained constant. Shortly after division, multiple tunneling nanotubes (TNTs) formed with pronounced inter-TNT variability in polarity and phase, while each TNT’s properties remained relatively stable over time, suggesting functional specialization. Concurrently, mitochondrial cristae dissociation exhibited transient increases in polarity and phase that returned to baseline within ~2 minutes, whereas control mitochondria remained constant, suggesting lipid redistribution from cristae through the outer membrane into cytoplasm.
Discussion
The study demonstrates that simultaneous mapping of lipid polarity (emission ratio) and phase/order (polarization modulation depth) reveals complex lipid heterogeneity across and within organelles in live cells. While in several compartments lower polarity correlated with higher order (consistent with higher sphingolipid/cholesterol content), lipid droplets counter this trend, exhibiting both low polarity and low order due to neutral lipid cores. Nuclear membrane and ER show high polarity yet relatively ordered membranes, highlighting the importance of lipid–lipid interactions beyond simple polarity metrics. SPOT’s correlative measurements complement mass spectrometry by providing live-cell, spatiotemporal information inaccessible to bulk compositional assays. Compared to existing fluorescence polarization modalities, SPOT achieves higher throughput by extracting spectral and polarization information from six images within hundreds of milliseconds, enabling long-term, minimally phototoxic monitoring. The observed remodeling during cytokinesis, TNT formation, and mitochondrial cristae dynamics underscores the method’s capability to capture coordinated lipid changes during key cellular processes and suggests mechanistic links between lipid composition, order, and membrane function.
Conclusion
SPOT enables high-dimensional, super-resolution imaging of live-cell lipid membranes, simultaneously resolving morphology, polarity, and phase using a single, universal dye. It uncovers pronounced lipid heterogeneity among organelles, within organelles (e.g., mitochondrial cristae vs outer membrane; lipid droplet core vs shell), and during dynamic processes such as endosome maturation and cell division, including TNT formation and mitochondrial cristae dissociation. The approach delivers improved measurement accuracy and high throughput suitable for long-term live-cell imaging, offering a powerful complement to biochemical lipidomics. Future directions include enhancing lateral resolution via SPOT-SIM3D, refining dye calibration using in vitro vesicles with defined compositions, integrating machine learning for automated organelle segmentation based on intensity–polarity–phase features, and expanding multiplexed imaging strategies to further correlate lipidomics with organelle interactome dynamics.
Limitations
- Spatial resolution: SPOT provides axial optical sectioning but remains diffraction-limited laterally (unless combined with SIM3D). Measurements reflect averages within the PSF; curved or unresolved crowded membranes reduce apparent modulation depth due to ensemble dipole orientations (e.g., Golgi).
- Dye–environment dependencies: Emission ratios and polarization readouts depend on dye penetration depth and orientation within membranes of varying composition; while relative comparisons within the same dye and conditions are robust, absolute quantitation may vary across lipid environments.
- Organelle classification ambiguity: Overlapping polarity–phase features can cause misclassification (e.g., Golgi vs late endosomes) when relying solely on heterogeneity plots and morphology.
- Crowded cellular environments can violate assumptions required by some polarization super-resolution methods; although SPOT mitigates out-of-focus background, dense structures can still complicate interpretation.
- Throughput vs channel limitations: While SPOT extends functional dimensions, typical microscopes have limited spectral channels; organelle identification benefits from combining morphology with polarity/phase and may require AI-based integration for robust segmentation.
Related Publications
Explore these studies to deepen your understanding of the subject.

