Economicsnpj Ocean Sustainability
Global hake production and trade: Insights for food security and supply chain resilience
A. Ospina-alvarez, G. M. Aragão, et al.
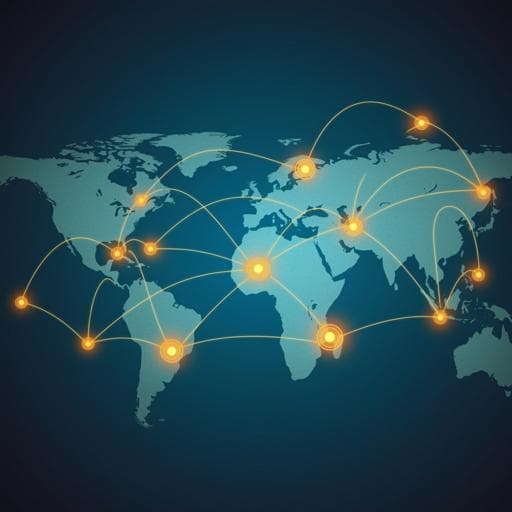
Explore the intricate global hake trade network in this study, which identifies Spain as the key importer and Namibia and South Africa as chief exporters. The research, conducted by Andrés Ospina-Alvarez, Guilherme Martins Aragão, Lucía López-López, Sebastián Villasante, and Joan Moranta, highlights the growth in trade values and the need for resilience in trading practices for sustainable hake management.
Related Publications
Explore these studies to deepen your understanding
Adjacent work that informs or extends this paper's methodology and findings.

Business
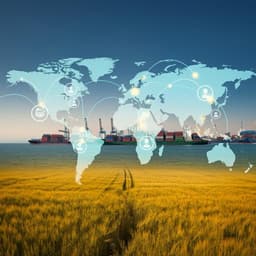
A global blockchain-based agro-food value chain to facilitate trade and sustainable blocks of healthy lives and food for all
K. Tyagi
Economics
Satellite forecasting of crop harvest can trigger a cross-hemispheric production response and improve global food security
T. Tanaka, L. Sun, et al.
Food Science and Technology
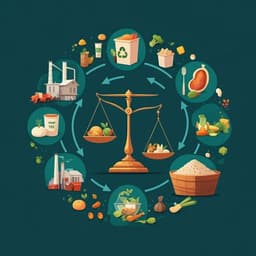
A framework to quantify mass flow and assess food loss and waste in the US food supply chain
W. Dong, K. Armstrong, et al.
Agriculture
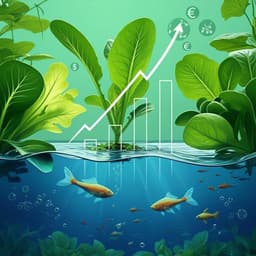
Integrated aquatic and terrestrial food production enhances micronutrient and economic productivity for nutrition-sensitive food systems
L. Ignowski, B. Belton, et al.


