Earth Sciences
Tropical cyclone activity over western North Pacific favors Arctic sea ice increase
L. Zeng, Y. Ha, et al.
The study investigates whether and how synoptic-scale tropical systems—specifically Western North Pacific (WNP) tropical cyclones—affect Arctic sea ice variability, focusing on the Arctic-Pacific Sector (APS). While Arctic sea ice has declined rapidly since 1979, with September exhibiting the steepest negative trend, the roles of internal climate variability, teleconnections from low latitudes, and tropical convection in modulating Arctic circulation and surface energy budgets have been increasingly recognized. Prior work has emphasized low-frequency SST-linked convection and intraseasonal tropical variability (e.g., MJO) influencing Arctic atmosphere and sea ice, yet the short-timescale effect (~10 days) of tropical cyclone activity remains understudied. This paper aims to identify and explain a robust teleconnection pathway from WNP TC activity to September APS SIC via Rossby wave excitation and associated dynamical–thermodynamic processes.
- Internal variability may account for up to ~60% of observed summer Arctic sea ice decline since 1979. Low-latitude SST-linked convection can drive Arctic circulation anomalies, with anticyclonic anomalies at 200 hPa warming and moistening the Arctic and enhancing downward longwave radiation (DLR), promoting melt.
- Tropical convection affects Arctic winter temperatures; the Madden–Julian Oscillation (MJO) modulates Arctic circulation, temperature, radiation, and the regional variability of sea ice. Tropical forcing plays a role in Barents–Kara Sea ice variability.
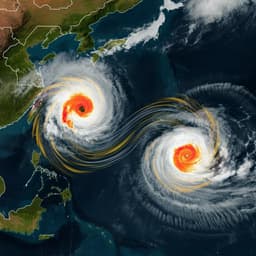
- Western North Pacific (WNP) hosts over one-third of global TCs; TC activity influences energy transport, large-scale circulation, precipitation, and feeds back onto ENSO intensity and diversity.
- Synoptic-scale signals like TCs can generate Rossby waves and potentially teleconnect to the Arctic, but prior studies have focused more on Atlantic TCs and largely on dynamics, with limited treatment of thermodynamic modulation. A systematic spatial–temporal linkage between WNP TCs and Arctic sea ice had not been characterized.
Observational analyses (1982–2020):
- Datasets: IBTrACS for TC best tracks and winds (ACE computation); NOAA OI SST V2 High-Resolution daily SIC (0.25°); ERA5 reanalysis hourly single- and pressure-level fields (interpolated to 1°) for temperature, winds, geopotential height, specific humidity, and surface DLR; NSIDC Polar Pathfinder Daily 25 km sea ice motion vectors; ERA5 SST for Niño3.4 index.
- Indices and regions: WNP ACE constructed on 2°×2° grid and aggregated over 10–35°N, 110–140°E; APS defined as 70–80°N, 160°E–140°W. Strong (weak) ACE years defined by ±0.8 standard deviation thresholds.
- Statistical analyses: • Lead–lag correlations at monthly and 10-day resolution between WNP ACE and APS SIC; assessment of statistical significance via two-tailed Student’s t-test. • Partial correlations removing ENSO (Niño3.4) to isolate the ACE–SIC relationship; empirical mode decomposition (EMD) used to address nonlinear ENSO effects. • Regression of circulation/thermodynamic fields (Z500, Z850, winds, temperature, humidity, DLR, moisture flux) onto mid-August ACE at lags: mid-Aug (0), late Aug (~10 d), early Sep (~20 d), mid-Sep (~30 d). • Maximum covariance analysis (MCA/SVD) between mid-August WNP ACE and mid-September Arctic SIC to identify coupled modes and quantify covariance explained. • Liang–Kleeman information flow method to assess causality from WNP ACE (mid-Aug) to APS SIC (mid-Aug to mid-Sep). • Rossby wave diagnosis using Takaya–Nakamura wave activity flux (WAF) applied to reanalysis fields.
- Case study: Year 1994 with exceptionally high August ACE examined for process consistency.
Model experiments:
- Atmospheric GCM: CAM6 (component of CESM2) at 0.9°×1.25°, 32 vertical levels to 3.6 hPa. Two 40-day experiments starting Aug 11, 2000: • CTRL: baseline climatological forcing (year-2000 levels), default initial conditions. • SEN: same as CTRL but with imposed sea level pressure anomalies over WNP (10–35°N, 110–140°E) derived from strong−weak ACE differences in mid-August (1982–2020), representing ACE-like forcing.
- Ensembles: 20 members each, generated via small initial temperature perturbations (order 1–20×10⁻¹); analysis based on ensemble means.
- Diagnostics from model: Z500 and WAF, surface temperature, low-tropospheric (1000–850 hPa) specific humidity and moisture flux, surface DLR; zonal-mean cross sections of T, Z, q. Significance tested at 90% level.
- Statistically significant linkage: September APS SIC correlates positively with August WNP ACE (monthly r=0.43, p<0.05). Using 10-day bins, mid-August (Aug 11–20) ACE leads APS SIC by ~30 days with peak r=0.52 (p<0.01). The relationship persists after removing ENSO’s linear and nonlinear effects (max r=0.52).
- Magnitude of SIC response: Composite of 10 strong vs 10 weak ACE years shows a significant ~40% increase in mid-September APS SIC during strong ACE years. In 1994, APS SIC increased by up to 30% 30 days after mid-August TC activity.
- Coupled variability: MCA between mid-August WNP ACE and mid-September Arctic SIC yields a leading mode explaining 30.7% of covariance, with time series correlation r=0.58 (p<0.01), highlighting strongest coupling over western WNP and APS.
- Dynamical pathway: WNP TCs act as a Rossby wave source in mid-August; wave trains propagate northeastward to the North Pacific and Bering Strait (late Aug), peak in early September, and reach the APS, inducing anomalous cyclonic circulation over the Arctic (notably ~250 hPa), with concurrent Aleutian anticyclonic anomalies. This reflects a deepened Arctic polar vortex.
- Thermodynamic effects: Upper-level cyclonic anomalies weaken adiabatic warming, leading to widespread Arctic surface cooling (APS Ts reductions exceeding 2 K), decreased lower-tropospheric specific humidity, reduced poleward moisture transport into the Bering Strait, and substantial local decreases in surface DLR (>5 W m⁻²) over the APS, favoring sea-ice increase.
- Sea ice dynamics: The anomalous cyclone weakens the usual anticyclonic Transpolar Drift and reduces sea ice export through Fram Strait, hindering melting and supporting higher APS SIC.
- Causality: Liang–Kleeman information flow indicates distinct causal influence from mid-August WNP ACE to APS SIC, strongest in mid-September.
- Model support: CAM6 simulations with ACE-like forcing reproduce Rossby wave propagation toward the Arctic, Arctic upper-level cyclonic anomalies, APS cooling, drying, and decreased DLR within 10–20 days, consistent with observed teleconnection. Simulated anomaly amplitudes are slightly overestimated and peak earlier than observations, but the mechanism is robust.
The findings address the central question of whether synoptic-scale tropical cyclone activity in the WNP can modulate Arctic sea ice on intraseasonal timescales. Evidence from observations, causality diagnostics, and targeted CAM6 experiments consistently shows that enhanced mid-August WNP TC activity excites planetary-scale Rossby waves that promote an anomalous cyclonic circulation over the Arctic within ~10–30 days. This circulation dynamically and thermodynamically conditions the APS for sea-ice growth by suppressing adiabatic warming, cooling and drying the lower troposphere, and reducing surface DLR, while dynamically impeding transpolar sea ice export via Fram Strait. These processes explain the positive ACE–SIC relationship and demonstrate a tangible tropics–Arctic teleconnection operating on synoptic-to-intraseasonal timescales. The results are relevant for improving Arctic sea ice predictability: mid-August WNP ACE provides a precursor signal for mid-September APS SIC, potentially adding predictive skill beyond ENSO-related influences.
This study identifies and mechanistically explains a positive teleconnection from mid-August WNP tropical cyclone activity to increased mid-September Arctic-Pacific Sector sea ice concentration. The pathway involves TC-excited Rossby waves, Arctic upper-tropospheric cyclonic anomalies (deepened polar vortex), reduced adiabatic warming, lower-tropospheric cooling and drying, diminished surface DLR, and impeded Fram Strait sea ice export. Observational statistics (lead–lag correlations, composites, MCA, causality) and CAM6 sensitivity experiments jointly support the mechanism. Given projections of intensifying and poleward-shifting tropical cyclone activity with warming, these teleconnections may increasingly influence the Arctic. Future research should quantify contributions from TCs in other basins, explore interaction and superposition effects across basins, and improve model representations of TC intensity, tracks, duration, and their downstream impacts to enhance sea ice prediction.
- The analysis focuses on climatological mean impacts and a specific season/lag, not event-by-event variability or full seasonal evolution.
- Only WNP TC activity is examined; potential combined or competing influences from TCs in other basins (e.g., Northeastern Pacific, Atlantic) are not quantified.
- Causality and teleconnections are tested with idealized ACE-like sea level pressure anomaly forcing in an atmosphere-only model; this simplifies TC characteristics (intensity, track, duration) and omits coupled ocean–ice feedbacks.
- CAM6 responses peak earlier and decay with time relative to observations, indicating sensitivity to background climate state and forcing idealization.
- Statistical significance often assessed at 90–99% levels, but uncertainties remain due to data limitations and potential residual confounders beyond ENSO.
Related Publications
Explore these studies to deepen your understanding of the subject.