Environmental Studies and Forestry
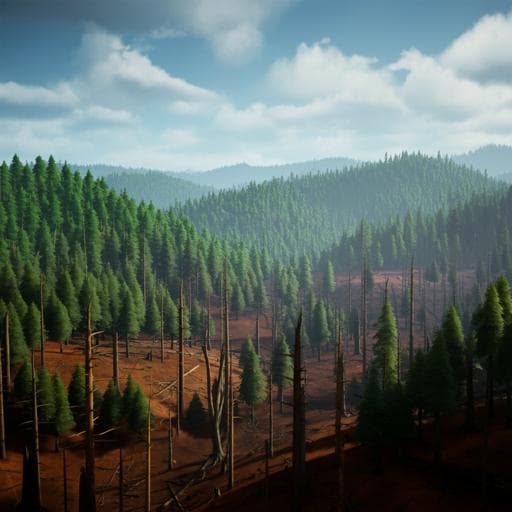
The effect of a political crisis on performance of community forests and protected areas in Madagascar
R. A. Neugarten, R. A. Rasolofoson, et al.
This study explores how a political crisis in Madagascar influenced community-managed forests and protected areas, revealing that post-crisis, deforestation accelerated more in community-managed forests than in state-protected areas. The research, conducted by Rachel A. Neugarten and colleagues, highlights potential vulnerabilities in community-based conservation amidst political turmoil.
~3 min • Beginner • English
Introduction
The study examines how a political crisis influences the relative effectiveness of two widespread conservation interventions—community forest management (CFM) and state-administered protected areas—in reducing deforestation. Many biodiversity-rich countries are politically fragile, making it crucial to understand which conservation strategies are resilient during instability and recovery. Madagascar, a global biodiversity hotspot with high poverty and heavy reliance on forest resources, experienced a prolonged political and economic crisis from 2009 to 2014. The research question is how the crisis and post-crisis period affected the relative performance of CFM versus protected areas administered by Madagascar National Parks (MNP), after accounting for confounding factors. The purpose is to inform conservation policy and practice in crisis-prone contexts by rigorously isolating causal effects on deforestation outcomes.
Literature Review
Prior work shows mixed performance of governance regimes: under certain contexts local communities can outperform state management in conserving forests, e.g., in Peru, India, Indonesia, and Tanzania; yet average effects of decentralized management on deforestation tend to be small. Placement biases complicate evaluations, as protected areas are often located in remote, less-threatened areas, inflating naïve estimates of effectiveness. Counterfactual-based studies—using matching and related methods—generally find more modest effectiveness of protected areas, while some decentralized and Indigenous lands show larger effects. Few studies evaluate conservation during crises; available evidence from Nepal, Colombia, Sierra Leone, and Rwanda links conflict to varied deforestation outcomes but often lacks controls for confounding. Sociopolitical context matters: weaker rule of law and elections can influence deforestation and protected area performance; in Madagascar, previous instability has been associated with increased deforestation. Prior evaluations in Madagascar found protected areas effective on average (1990–2010) and mixed effects for CFM (2000–2010), with contract terms (e.g., prohibiting commercial use) moderating impacts.
Methodology
Design: Quasi-experimental evaluation using remotely sensed annual deforestation data and a combination of statistical matching and an event study design to estimate the causal effect of the 2009–2014 political crisis on the relative performance of CFM vs. MNP in avoiding deforestation.
Units and sampling: Unit of analysis is 90 m grid cells with some forest cover in 2005 (baseline). Sample includes 362 CFM sites and 45 MNP protected areas, all established pre-2005, to ensure a pre-crisis baseline (2005–2009), crisis (2010–2014), and post-crisis (2015–2020). Initial samples: 12,000 CFM points and 36,000 candidate MNP points; after matching and removing overlaps, final matched datasets include 11,626 CFM and 11,626 matched MNP grid cells (4,244 unique MNP cells). A renewed-CFM subset (as a proxy for implementation) was similarly sampled (11,886 renewed CFM and 11,886 matched MNP; 3,155 unique MNP cells).
Outcome: Annual deforestation per grid cell, computed as year-to-year decrease in forest cover percentage. Base data: 30 m forest cover (2000) combined with global tree cover loss (2000–2020); aggregated to 90 m and 270 m to yield quasi-continuous percentages (0–100%). Forest regrowth was excluded due to limited natural regeneration and lack of suitable data.
Matching: 1:1 genetic matching with replacement to balance time-invariant confounders affecting both designation and deforestation risk, with exact matching within vegetation zones (eastern humid, western dry deciduous, southern dry spiny). Covariates for matching include suitability for irrigated rice, elevation, slope, historic precipitation (1970–2000), 2005 distance to forest edge, distances to roads, cart tracks, villages, urban centers, 2005 population density, and vegetation type. Balance improved substantially post-matching, eliminating most pre-match differences.
Event study: Ordinary least squares with grid-cell fixed effects and clustered standard errors at the site level (CFM or MNP). Model includes interactions for CFM and years post-crisis to estimate yearly differential effects relative to MNP, controls for pre-crisis linear trends, and incorporates time-variant covariates: annual distance to forest edge, population density, average rice price and its volatility, drought severity (PDSI), maximum precipitation, maximum temperature, and maximum wind speed (cyclone proxy). Year dummies control for common time shocks. Robustness checks include multilevel clustering (site and region), analysis at 270 m resolution, and a DiD specification (reported in supplements). Heterogeneity analyses interact CFM with distance to urban centers, roads, villages, population density, development level, and security indicators.
Temporal framing: Pre-crisis 2005–2009; crisis 2010–2014 (first event year reported as 2010 due to trend control); post-crisis 2015–2020.
Software/data sources: R packages matchit, cobalt, fixest; GIS tools (ArcMap, QGIS, terra); TerraClimate, WorldPop, World Bank rice price data; protected area and CFM polygons (with restrictions for CFM).
Key Findings
- Naïve rates: Annual deforestation rates were about three times higher in CFM than in MNP across periods: pre-crisis 0.7% vs. 0.2%; crisis 1.1% vs. 0.4%; post-crisis 2.0% vs. 0.7% (Table 1). National forest cover declined by 16.5% from 2005 to 2020 (9.7 to 8.1 mha); within MNP by 6.5% (1.2 to 1.1 mha) and within CFM by 20.9% (487,900 to 385,700 ha).
- Event study (after matching and controls): During the first four crisis years, CFM and MNP performed similarly poorly (increasing deforestation) with no significant difference. CFM performed significantly worse than matched MNP in the last crisis year and several post-crisis years (2014–2017), with CFM–MNP differences of 1.7 ± 1.4%/yr to 2.4 ± 1.0%/yr (p<0.05; marginal p<0.1 under multilevel clustering). From 2018–2020, CFM still underperformed but differences were not statistically significant.
- Magnitude: Given 475,333 ha of CFM forest in 2008, excess loss in CFM relative to matched MNP is estimated at 8,103 ± 6,435 to 11,532 ± 9,508 ha/year, totaling 36,483 ± 28,775 ha (≈51,047 ± 40,228 soccer fields) from 2014–2017.
- Robustness: Results hold for renewed CFM subset; coarser 270 m resolution increased significance (p<0.01) of post-crisis differences.
- Heterogeneity: CFM farther from urban centers performed better than those near cities in certain post-crisis years (2015, 2016, 2018), but even remote CFM were less effective than similarly remote MNP. No consistent moderating effects were found for distance to roads/villages, population density, development, or security.
- Covariates: No significant effects of climate variables or rice price dynamics on the observed CFM–MNP performance gap.
Discussion
The analysis reveals a previously underreported acceleration of deforestation at the end of Madagascar’s 2009–2014 political crisis, with community forests particularly vulnerable relative to protected areas managed by MNP. This suggests that neither community-based nor state-based mechanisms were robust during crisis years, likely due to reduced capacity and resources for enforcement, but that state protection showed greater resilience as pressures intensified post-crisis. Potential mechanisms for the post-crisis spike include lagged effects of funding cuts, lingering governance weaknesses and corruption, election-related unrest and fires, and possibly increased post-crisis economic activities; none were directly confirmed, and per-capita GDP did not rise substantially in 2014–2017. Even in remote areas, CFM underperformed matched MNP, indicating that designation and institutional support matter alongside remoteness. Policy implications include the need to bolster community institutions and provide external support to CFM to withstand shocks, including strengthening tenure security, social cohesion, recognition of community rights, and support from national authorities. The results underscore the importance of context-sensitive conservation strategies that remain effective through political and economic instability.
Conclusion
This study provides a causal comparison of community forest management and state-managed protected areas during and after a national political crisis in Madagascar. While both regimes saw increased deforestation during the crisis, community forests performed significantly worse than comparable MNP areas in the immediate post-crisis years when pressures intensified. The findings highlight the limited resilience of community-based conservation absent sustained institutional and financial support and suggest that state protection can provide greater buffering under heightened pressure. Future research should examine mechanisms behind post-crisis deforestation spikes, collect detailed data on CFM contract terms and de facto management, incorporate land tenure dynamics, and extend analyses across countries and crises to generalize lessons. Strengthening community rights, social cohesion, tenure security, and multi-level support from government and NGOs are promising pathways to improve CFM performance through crises.
Limitations
- Unobserved time-variant confounders cannot be fully ruled out despite extensive controls and fixed effects.
- Remote sensing limitations, especially for detecting selective logging and in areas with high cloud cover and steep slopes, may bias estimates; regrowth dynamics were not included.
- Overlapping designations led to exclusion of ambiguous areas; CFM–MNP overlap complicates clean attribution.
- Representativeness: Results reflect CFM relative to matched, similarly accessible subsets of MNP, not overall MNP performance; site-level matching was infeasible due to few MNP and systematic differences.
- Spatial autocorrelation may persist across nearby sites despite clustering at the site level; multilevel clustering affected significance levels for some years (p<0.1).
Related Publications
Explore these studies to deepen your understanding of the subject.

