
Environmental Studies and Forestry
Potential impact of climate change on Nearctic leafhopper distribution and richness in North America
A. A. Santos, J. Jacques, et al.
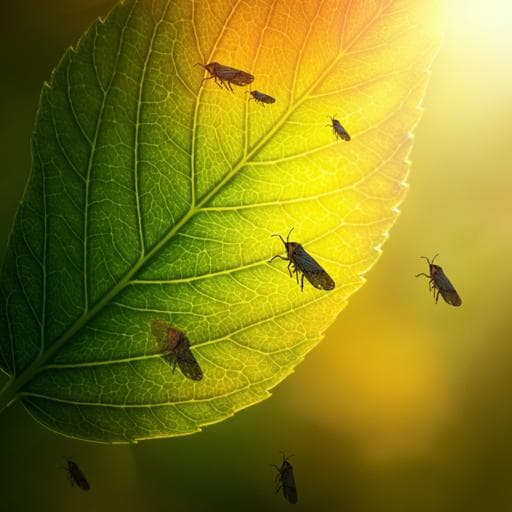
This research, conducted by Abraão Almeida Santos, Jordanne Jacques, and Edel Pérez-López, explores how climate change is reshaping the habitat and distribution of 14 leafhopper species. The study reveals potential northward expansions in Canada, emphasizing crucial implications for sustainable pest management practices.
~3 min • Beginner • English
Introduction
Climate change is driving alterations in species distributions and shifts in geographic ranges, with crop pests and diseases moving poleward at approximately 2.7 km per year since 1960. Responses to warming vary by taxa and biogeographic origin: tropical pests often live near thermal maxima and may lose suitable habitat with warming, whereas temperate species can tolerate broader climatic variability and may experience expanded suitability. Species distribution modeling (SDM/ENM) has become a key tool to explore climate impacts on species distributions, yet entomological research has focused disproportionately on Lepidoptera and Diptera, leaving Hemiptera—important plant disease vectors—comparatively understudied. Leafhoppers (Cicadellidae) are diverse herbivores with high endemism; the Nearctic region hosts nearly 3,000 species, many adapted to seasonal extremes. Temperature and wind patterns are likely primary drivers of distribution, with warming shortening life cycles and continental winds aiding northward dispersal. Leafhoppers’ main recognized role in agroecosystems is the transmission of plant pathogens, especially phytoplasmas, which cause hundreds of diseases across numerous crops. In the Nearctic, 38 species are known or suspected phytoplasma vectors, and recent reports suggest a tripling of phytoplasma disease incidence in the past decade. Potential drivers include improved diagnostics, increased vector abundance, previously unidentified efficient vectors, and range expansions. A key knowledge gap remains regarding how climate change will affect the distributions, species richness, and niche similarity of Nearctic leafhopper species associated with phytoplasma diseases. This study addresses that gap by modeling current and future potential distributions and environmental niche similarity for 14 such species in North America using ENM-based methods, to inform risk assessment and management under climate change.
Literature Review
Prior work documents poleward shifts of pests under warming and highlights complexities in insect thermal tolerances, with temperate species often showing broader climatic resilience. ENM/SDM methods, including MaxEnt, are widely used to forecast climate-driven range changes, but entomology research has focused mainly on Lepidoptera and Diptera, creating a bias that underrepresents Hemiptera despite their importance as plant disease vectors. Leafhoppers exhibit strong regional endemism; the Nearctic region is a hotspot with high diversity and adaptation to climatic extremes. Leafhoppers transmit phytoplasmas (Candidatus Phytoplasma spp.), causing economically impactful diseases such as aster yellows, bushy stunt of corn, false blossom in berries, green petal in strawberries, and grapevine yellows. Surveys in North American vineyards and berry crops have documented rich leafhopper assemblages and suggest increasing species richness and changing community composition, although methodologies vary among studies, limiting direct comparisons. Recent increases in phytoplasma disease reports across the Nearctic may reflect improved molecular diagnostics, altered vector abundance, unidentified efficient vectors, and/or range expansions. Collectively, the literature indicates both the feasibility and urgency of modeling Nearctic leafhopper distributions under climate change to anticipate plant health impacts.
Methodology
Study aim: quantify current and future potential species richness and environmental niche similarity for 14 Nearctic leafhopper species associated with phytoplasma diseases in North America using ENM methods.
Species: Amplicephalus inimicus; Ceratagallia humilis; Colladonus geminatus; Edwardsiana rosae; Empoasca fabae; Erythroneura comes; Erythroneura vitis; Erythroneura ziczac; Exitianus exitiosus; Graphocephala fennahi; Jikradia olitoria; Macrosteles quadrilineatus; Paraphlepsius irroratus; Scaphoideus titanus.
Occurrence data: Records (lat/long) compiled from GBIF (including iNaturalist) and recent literature, restricted to 1970–present to match environmental layers (1970–2000). Duplicates within ~5 km pixels removed; spatial thinning retained one record per 5 km² grid cell. Final occurrence counts: A. inimicus 300; C. humilis 33; C. geminatus 33; E. rosae 66; E. fabae 852; E. comes 71; E. vitis 189; E. ziczac 110; E. exitiosus 578; G. fennahi 912; J. olitoria 2376; M. quadrilineatus 277; P. irroratus 280; S. titanus 94.
Environmental variables (current): WorldClim v2.1 bioclim variables (1970–2000) at ~5 km². Pearson correlation used to reduce multicollinearity (r ≥ 0.7 threshold). Five retained variables: annual mean temperature (bio1), mean diurnal range (bio2), temperature annual range (bio7), annual precipitation (bio12), precipitation seasonality (bio15).
Future climate scenarios: GISS-E2-1-G GCM under SSP1-2.6, SSP2-4.5, SSP3-7.0, SSP5-8.5 for 2041–2060 at ~5 km² (WorldClim CMIP6). Regional projections indicate increased annual mean temperatures (max ~28.6 °C under SSP1-2.6 to ~31 °C under SSP5-8.5) mainly in southern areas; annual precipitation generally decreases in the west relative to the east; precipitation seasonality shows the opposite trend. Layers cropped to a North America shapefile.
Modeling tools and setup: MaxEnt (Java v3.4.1) via ENMeval; Wallace app v2.0.5; SDMtoolbox Pro v0.9.1; ArcGIS Pro v3.1.2; R packages raster, ENMeval, ade4, igraph, ecospat. Background: 10,000 points across North America. Clamping enabled to avoid extrapolation. Tested feature classes: L, LQ, H, LQH, LQHP; regularization multipliers 0–5 (step 0.5). Two partitioning strategies evaluated: spatial block and random k-fold (k=4); random k-fold retained due to better performance and feasibility with sparse datasets. For each species, 100 candidate models run across FC and RM combinations; across species and partitions 2,800 models were initially generated. Best models selected by AUC and TSS.
Model evaluation: AUC (0–1) used with caution for presence-only data; TSS (−1 to 1) used to address AUC limitations, with higher values indicating better sensitivity and specificity. Binary thresholds derived from maximum test sensitivity plus specificity (MaxTSS).
Projections and richness: Continuous suitability (cloglog) outputs converted to rasters and binarized (suitable/unsuitable) using MaxTSS thresholds. Species richness maps generated by stacking binary maps and summing unique species per pixel using SDMtoolbox’s biodiversity measurement function for current and each SSP scenario.
Environmental niche similarity: PCA on the five environmental variables to reduce dimensionality, computing species occurrence density along the first two components. Pairwise similarity tests among all 14 species (91 combinations) performed by randomizing environments within background extent to generate null overlaps; significance if observed overlap exceeded 95% of null overlaps (one-tailed, p < 0.05). Results compiled into a p-value matrix, binarized (1 = similar; 0 = random). Network analysis quantified connectivity and network density (0–1) under current and future scenarios to assess overall niche similarity patterns.
Key Findings
- Model performance: High discriminatory power across species, with AUC ranging 0.883–0.980 and TSS 0.629–0.864.
- Variable importance: Temperature-related variables were the dominant contributors for most species. Precipitation-related variables had greater influence for Erythroneura comes, E. vitis, Graphocephala fennahi, and Jikradia olitoria. Near-equal temperature and precipitation contributions occurred for Ceratagallia humilis (Temperature 51.11%; Precipitation 48.89%) and Scaphoideus titanus (Temperature 50.03%; Precipitation 49.97%).
- Current richness: Highest potential species richness in eastern North America (southern Ontario and Québec) and a secondary hotspot in the southwestern United States; richness declines in arid (grasslands of Canada and the U.S.) and colder regions (e.g., Great Plains), with low richness in northern Canada and the U.S.
- Future richness: Overall increase in suitable areas for leafhopper richness under all four SSP scenarios (2041–2060), with some decreases at specific richness levels (decrease in richness levels 11 and 13 under SSP1-2.6 and SSP2-4.5; decrease at richness level 14 under SSP3-7.0 and SSP5-8.5). Areas with current highest richness are projected to persist and expand slightly eastward. A new high-richness area emerges in southern Alberta and British Columbia, and expansions occur in the southeast and northeast. Northern Canada becomes increasingly suitable for more species.
- Environmental niche similarity: Most species share similar environmental niches under current climate, with network density 0.467. Species with lower similarity include Colladonus geminatus, Edwardsiana rosae, and Exitianus exitiosus (the latter sharing similarity with at most three species). Under future scenarios, niche similarity increases: network density rises to 0.523 (SSP1-2.6), 0.533 (SSP2-4.5), 0.571 (SSP3-7.0), and 0.542 (SSP5-8.5), indicating more interconnected environmental niches and likely greater species overlap.
- Geographic shift: Projections consistently indicate a northward shift and expansion of suitable environments, particularly into northern Canada, while arid regions remain comparatively less suitable.
Discussion
The study addressed how climate change may alter distributions, richness, and environmental niche similarity of Nearctic leafhoppers associated with phytoplasmas. Results indicate that warm and humid regions currently support the highest richness, whereas arid and colder regions support fewer species. Temperature emerges as the principal driver of distributions for most species, consistent with life-history traits such as diapause and migration, and with evidence that warmer conditions shorten life cycles and increase generations per year. Precipitation modulates occurrence for several species, influencing survival and host plant condition.
Future scenarios consistently show expansion of suitable areas, particularly northward, and increasing niche similarity among species, implying greater potential co-occurrence and overlap. Such changes could elevate risks of phytoplasma transmission, as leafhopper activity, migration, and earlier seasonal arrival intensify under warming conditions. Observations from recent regional surveys align with model projections, showing increasing richness and new records in northern and eastern locales, although methodological differences among surveys caution against direct quantitative comparisons.
These findings are relevant for sustainable agriculture and pest management: persistent suitability in current hotspots, coupled with expansion into new northern areas, suggests the need to revise monitoring, forecasting, and integrated pest management strategies. Anticipated increases in overlap and vector abundance could heighten disease pressure, necessitating proactive approaches including improved surveillance, resistance management, and exploration of biocontrol and biotechnological tools.
Conclusion
This work provides the first continent-wide assessment of potential species richness and environmental niche similarity for 14 Nearctic leafhopper species associated with phytoplasma diseases under current and future climates. Using robust ENM workflows, it shows persistent high-richness areas in eastern North America, emerging hotspots in western Canada, and a general northward expansion of suitability. Environmental niche similarity is already high for most species and is projected to increase under all SSP scenarios, implying greater potential co-occurrence and overlap.
Future research should: (1) incorporate biotic interactions (natural enemies, hosts), seasonal dynamics, and wind patterns into mechanistic or hybrid models; (2) standardize survey methodologies across regions and years to validate overlap and richness trends; (3) improve taxonomic resolution and georeferencing, including historical data where appropriate; (4) integrate phenology and dispersal into predictive frameworks; and (5) evaluate management interventions (biocontrol, RNAi, host plant resistance) under projected climate conditions to mitigate vector and disease risks.
Limitations
- Models consider abiotic climatic constraints only; biotic interactions (natural enemies, predators, host availability), seasonal effects on suitability, and changes in continental wind patterns were not included, potentially overestimating the fundamental vs realized niche.
- Temporal filtering excluded pre-1970 records to match environmental layers; this may omit valid historical occurrences that still reflect current distributions (e.g., Scaphoideus titanus), but was necessary to avoid temporal bias.
- Some literature sources provided only presence/absence without coordinates, limiting inclusion. Taxonomic complexity (e.g., species complexes such as Ceratagallia humilis) may confound true absences with nomenclatural issues.
- Many Nearctic leafhoppers likely do not occupy their full potential ranges, and actual distributions remain unknown or understudied in several areas, which can affect model transferability.
- Presence-only modeling and AUC interpretation limitations persist; although TSS was used to mitigate, uncertainties remain, especially for species with few records.
Related Publications
Explore these studies to deepen your understanding of the subject.