
Multi-model assessment identifies livestock grazing as a major contributor to variation in European Union land and water footprints
D. Vanham, M. Bruckner, et al.
Explore these studies to deepen your understanding
Adjacent work that informs or extends this paper's methodology and findings.

Developing a BOPPPS (Bridge-in, Objectives, Pre-assessment, Participatory Learning, Post-assessment and Summary) model combined with the OBE (Outcome Based Education) concept to improve the teaching outcomes of higher education
Z. Xu, L. Ge, et al.

Efficacy of early PET-CT directed switch to carboplatin and paclitaxel based definitive chemoradiotherapy in patients with oesophageal cancer who have a poor early response to induction cisplatin and capecitabine in the UK: a multi-centre randomised controlled phase II trial
S. Mukherjee, C. N. Hurt, et al.
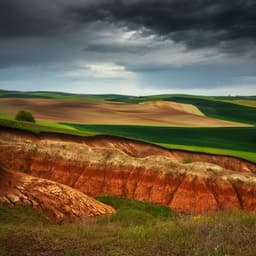
Drought as a possible contributor to the Visigothic Kingdom crisis and Islamic expansion in the Iberian Peninsula
J. Camuera, F. J. Jiménez-espejo, et al.
Climate and land use changes explain variation in the A horizon and soil thickness in the United States
Y. Zhang, A. E. Hartemink, et al.


