Environmental Studies and ForestryNature Communications
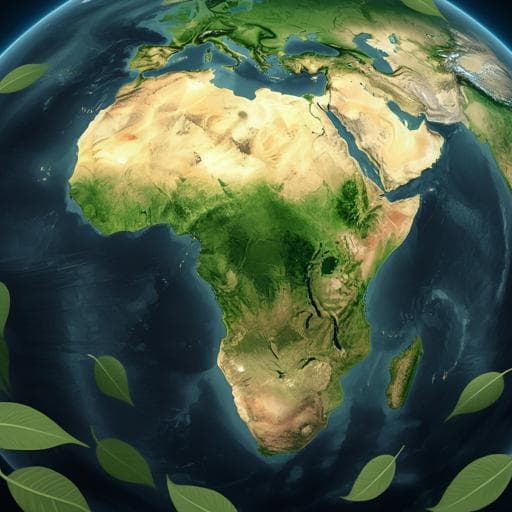
More than one quarter of Africa's tree cover is found outside areas previously classified as forest
F. Reiner, M. Brandt, et al.
This groundbreaking research by Florian Reiner and colleagues utilizes PlanetScope nanosatellite imagery to unveil that a staggering 29% of tree cover in Africa exists outside previously defined forest areas. This high-resolution mapping could change the way we assess land use impacts and formulate natural climate solutions.
Related Publications
Explore these studies to deepen your understanding
Adjacent work that informs or extends this paper's methodology and findings.

Veterinary Science
One Health collaboration is more effective than single-sector actions at mitigating SARS-CoV-2 in deer
J. D. Cook, E. Rosenblatt, et al.

Environmental Studies and Forestry
Surface warming in global cities is substantially more rapid than in rural background areas
Z. Liu, W. Zhan, et al.

Environmental Studies and Forestry
Human degradation of tropical moist forests is greater than previously estimated
C. Bourgoin, G. Ceccherini, et al.

Psychology
Educational attainment reduces the risk of suicide attempt among individuals with and without psychiatric disorders independent of cognition: a bidirectional and multivariable Mendelian randomization study with more than 815,000 participants
D. B. Rosoff, Z. A. Kaminsky, et al.


