Earth SciencesCommunications Earth & Environment
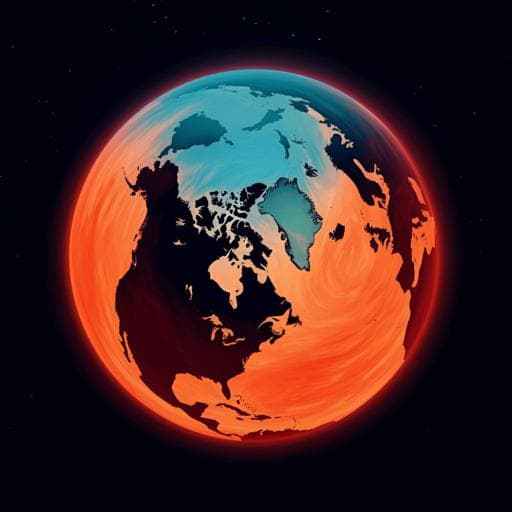
Manifold increase in the spatial extent of heatwaves in the terrestrial Arctic
M. Rantanen, M. Kämäräinen, et al.
Discover how the expanding spatial extent of heatwaves in the Arctic could impact ecosystems and societies. This groundbreaking research, conducted by Mika Rantanen, Matti Kämäräinen, Miska Luoto, and Juha Aalto, reveals alarming trends in heatwave severity over the decades, with projections indicating continued growth into the future.
Related Publications
Explore these studies to deepen your understanding
Adjacent work that informs or extends this paper's methodology and findings.

The Arts
From traditional to digital contexts: new characteristics of the public's spatial perception of urban streets in the age of technology
Z. Xing, R. Zhao, et al.

Transportation
Research on the spatial spillover effect of high-speed railway on the income of urban residents in China
Y. Liu, D. Tang, et al.
Earth Sciences
Continuous increase in evaporative demand shortened the growing season of European ecosystems in the last decade
M. Rahmati, A. Graf, et al.
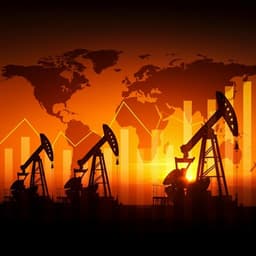
Economics
Assessing the extent and persistence of major crisis events in the crude oil market and economy: evidence from the past 30 years
Q. Zhang, Y. Hu, et al.


