
Earth SciencesNature Communications
Large-scale emergence of regional changes in year-to-year temperature variability by the end of the 21st century
D. Olonscheck, A. P. Schurer, et al.
This study by Dirk Olonscheck, Andrew P. Schurer, Lucie Lücke, and Gabriele C. Hegerl explores how human-induced climate change is reshaping temperature variability across the globe. By the end of the 21st century, increased variability is expected over tropical land while high latitudes may experience a decrease. These findings underline the critical need for urgent mitigation efforts to avert severe global impacts.
Related Publications
Explore these studies to deepen your understanding
Adjacent work that informs or extends this paper's methodology and findings.
Environmental Studies and Forestry
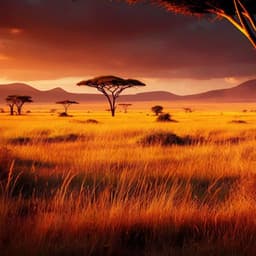
Major distribution shifts are projected for key rangeland grasses under a high-emission scenario in East Africa at the end of the 21st century
M. Messmer, S. Eckert, et al.

Earth Sciences
Effects of paleogeographic changes and CO₂ variability on northern mid-latitudinal temperature gradients in the Cretaceous
K. Gianchandani, S. Maor, et al.
Food Science and Technology
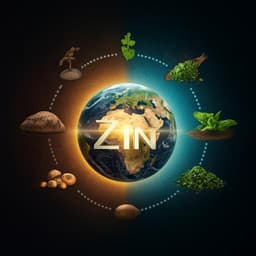
Mandatory large-scale food fortification programmes can reduce the estimated prevalence of inadequate zinc intake by up to 50% globally
K. R. Wessells, M. S. Manger, et al.
Earth Sciences
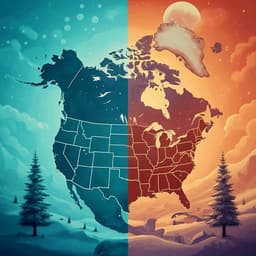
Amplified warming of North American cold extremes linked to human-induced changes in temperature variability
R. Blackport and J. C. Fyfe


