Earth Sciencesnpj Climate and Atmospheric Science
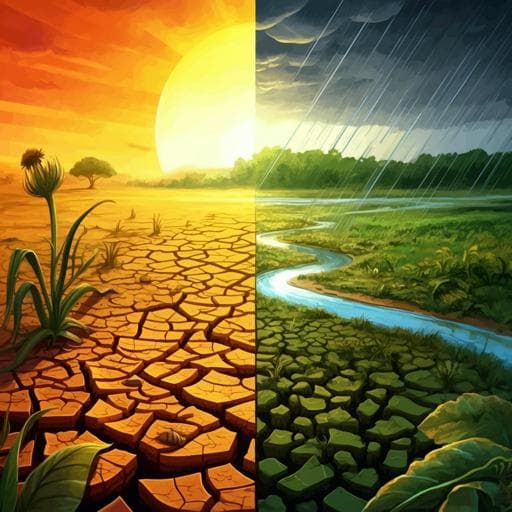
Increased risk of flash droughts with raised concurrent hot and dry extremes under global warming
Z. Zeng, W. Wu, et al.
This research, conducted by Zhaoqi Zeng, Wenxiang Wu, Josep Peñuelas, and others, explores the alarming rise in flash droughts worldwide, revealing their rapid onset, increased frequency, and longer duration. The study highlights the urgent need for improved climate models to better understand these swift climatic shifts and their implications for agriculture and ecosystems.
Related Publications
Explore these studies to deepen your understanding
Adjacent work that informs or extends this paper's methodology and findings.
Earth Sciences
Increased impact of heat domes on 2021-like heat extremes in North America under global warming
X. Zhang, T. Zhou, et al.
Earth Sciences
Anthropogenic warming and intraseasonal summer monsoon variability amplify the risk of future flash droughts in India
V. Mishra, S. Aadhar, et al.
Earth Sciences
Global projections of flash drought show increased risk in a warming climate
J. I. Christian, E. R. Martin, et al.

Medicine and Health
Longitudinal associations of dietary fiber and its source with 48-week weight loss maintenance, cardiometabolic risk factors and glycemic status under metformin or acarbose treatment: a secondary analysis of the March randomized trial
J. Liu, Y. An, et al.


