logo
ResearchBunny Logo
Global projections of flash drought show increased risk in a warming climate

Earth Sciences

Global projections of flash drought show increased risk in a warming climate

J. I. Christian, E. R. Martin, et al.

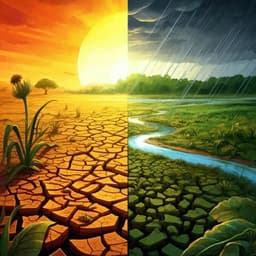
Flash droughts, with their rapid onset and severe impacts on agriculture, are on the rise due to climate change. This study, conducted by Jordan I. Christian and colleagues, reveals alarming increases in flash drought frequency and cropland risk, particularly in North America and Europe, under high emissions scenarios. Don't miss the insights gathered from global climate model simulations!

00:00
00:00
~3 min • Beginner • English
Introduction
Global population growth and the associated doubling of agricultural demand by mid-century will strain sustainable food security. Climate variability and change are projected to further impact cropland expansion and intensification required to meet this demand. Drought, particularly rapid-onset flash drought, poses complex challenges because it intensifies quickly with limited warning, leading to severe impacts on agriculture, ecosystems, and human systems, as exemplified by the 2010 western Russia event. This study addresses two questions: (1) What are the projected trends in flash drought frequency globally in a warming climate? (2) How does agricultural risk from flash drought change in the future? Using CMIP6 simulations across historical and future scenarios, the study aims to quantify changes in flash drought occurrence and cropland risk, identify hotspot regions, and relate changes to drivers such as precipitation and evaporative demand.
Literature Review
The paper situates its work within extensive literature indicating increases in various drought types under climate change, though with regional uncertainties tied to precipitation projections, particularly in monsoon regions. Prior studies highlight consistent elevated drought risk in areas such as Central America, Europe, and the Amazon. Flash droughts, defined by rapid intensification, have been documented to cause cascading impacts (heatwaves, wildfires, crop losses) with reduced lead times for mitigation. Reanalysis-based and modeling studies have demonstrated the utility of evapotranspiration- and soil moisture-based indicators (e.g., SESR) for detecting flash droughts and their correspondence with observed impacts (e.g., USDM). Regional studies found increased flash drought risk in southeastern China and complex responses in India due to monsoon variability. Previous work generally identified precipitation deficits as the primary historical driver of flash droughts, with evaporative demand as a secondary contributor, while recent projections suggest increases in duration and severity of flash droughts. This study builds on multivariate identification frameworks and ensemble model approaches to extend projections globally.
Methodology
The study analyzes flash drought using six CMIP6 models (IPSL-CM6A-LR, MPI-ESM1-2-HR, MPI-ESM1-2-LR, MRI-ESM2-0, NorESM2-LM, NorESM2-MM) for historical (1850–2014) and future scenarios SSP126, SSP245, and SSP585 (2015–2100). To quantify flash drought development, daily evapotranspiration (ET), potential evapotranspiration (PET), and soil moisture were used to compute the standardized evaporative stress ratio (SESR = standardized ET/PET) and to define drought thresholds via soil moisture. PET was computed using the FAO Penman–Monteith equation; 2-m wind speed was estimated from 10-m wind using a standard method. SESR and soil moisture were aggregated to pentads and smoothed using a Savitzky–Golay filter (degree 4, half-window 10; 21-pentad window) to reduce noise while preserving higher moments. The change in SESR between pentads (ΔSESR) was standardized (ASESR) relative to 1980–2014 climatology. Flash drought events were identified using three criteria: (1) ASESR at or below the 25th percentile, indicating rapid intensification; (2) minimum length of five pentad-to-pentad SESR decreases (six pentads; ~30 days) to distinguish from short dry spells; and (3) final root-zone soil moisture below the 20th percentile to ensure drought conditions were reached. Percentiles were computed per grid and pentad from 1980–2014 to maintain a consistent reference across the full model period. Identification windows were restricted to months with sufficient evaporative demand: March–October for >30°N, September–April for >30°S, and year-round for 30°S–30°N. Historical model performance (1980–2014) was evaluated against four reanalyses (MERRA, MERRA-2, ERA-Interim, ERA5). Land-use states (historical and SSPs) were from LUH2 v2f and used to quantify cropland exposure. Ensemble means were created by bilinearly interpolating datasets to 0.5°×0.5° and averaging across models for each experiment. Flash drought years were counted where at least one event occurred; annual spatial coverage was computed as the percent of domain affected. Arid/cold regions were masked using an aridity index threshold (AI<0.2) and a PET threshold (<1 mm/day during the growing season) to focus on regions with potential for rapid ET-driven drying. No individual model bias correction was applied, favoring ensemble averaging to avoid introducing unphysical future trends. The study also analyzed changes in precipitation, PET, and root-zone soil moisture, and related regional changes in flash drought frequency to changes in precipitation and PET to assess drivers.
Key Findings
- CMIP6 historical simulations reproduce the spatial patterns and seasonal cycles of flash drought occurrence seen in reanalyses (1980–2014), with slight underestimation at low–mid latitudes and slight overestimation at higher northern latitudes, providing confidence for projections. - By late 21st century (2066–2100), global flash drought occurrence increases under all scenarios relative to 1980–2014: SSP126 +6.0%, SSP245 +9.5%, SSP585 +8.2%. Largest regional increases occur in Europe and the Amazon. Some regions (Sahel, India, northern Australia) show divergent behavior, including decreases under SSP585 but neutral/slight increases under SSP126/SSP245. - Across 15 hotspot regions, most show increasing flash drought frequency through the 21st century: increases in 12/15 (SSP126), 13/15 (SSP245), and 10/15 (SSP585), with many trends statistically significant (p<0.1). Regions with strong increases include the Iberian Peninsula, eastern Europe, western Russia, eastern Amazon, and Asia Minor; divergent trends occur in northeastern China, India, the Great Rift Valley, and northern Australia. - Cropland risk increases on all continents in all scenarios. Under SSP585, the percentage of cropland experiencing flash drought increases markedly between 2015 and 2100 (30-year moving means): North America from 32% to 49%; Europe from 32% to 53%; Africa from 35% to 47%; Asia from 28% to 38%; South America from 37% to 50%. SSP126 and SSP245 generally project lower risks than SSP585, with some continents (e.g., Africa, North America) showing a pronounced “tipping” to higher risk only in SSP585. - Drivers: Regions with increased PET and decreased precipitation tend to show the largest increases in flash drought frequency. Among 14 hotspot regions with increased frequency in all scenarios (all except India), 13 show larger positive percent changes in PET than negative changes in precipitation; only the eastern Amazon shows a larger precipitation decrease than PET increase. Variation in flash drought frequency is more strongly related to PET change (r^2=0.674) than precipitation change (r^2=0.529); the combined metric (-ΔP + ΔPET) explains the most variance (r^2=0.821), underscoring joint control by reduced precipitation and increased evaporative demand. - Intensification rates of flash drought increase globally under all scenarios, largest in SSP585 (global +32.1%), with hotspots >70% in northern South America, the Sahel, and parts of India. PET increases are a primary contributor; in the Amazon, elevated intensification aligns with deforestation and land-cover change that extend dry periods and reduce ET and rainfall. - Temperature and PET increases are larger at higher latitudes and under higher-forcing scenarios, aligning spatially with increased flash drought occurrence (e.g., Europe, higher-latitude North America). Regions with minimal PET increases (e.g., Sahel, India) tend to exhibit negligible or decreased flash drought frequency relative to historical baselines. - Historically, cropland area impacted by flash drought was decreasing or stationary depending on continent, but projections show consistent increases across all continents and scenarios in the future.
Discussion
The study directly answers its research questions by demonstrating that flash drought frequency is projected to increase globally throughout the 21st century under all examined SSP scenarios, with the largest increases under higher radiative forcing and fossil fuel usage. It also shows that agricultural exposure to flash drought will increase on every continent, with particularly large increases under SSP585 in North America and Europe. These findings indicate that following lower or intermediate emissions pathways (SSP126/SSP245) can substantially reduce annual cropland risk compared to SSP585. Mechanistically, projected increases in evaporative demand (PET), driven largely by warming, often outweigh projected precipitation increases or small decreases, leading to more rapid soil moisture depletion and higher flash drought likelihood. Where precipitation increases substantially (e.g., parts of northeast China) or PET increases are small (e.g., Sahel, India), projected flash drought frequency changes are muted or even negative, especially under SSP585. The results highlight compounding risks: faster intensification rates reduce lead time for mitigation, and concurrent cropland expansion elevates the absolute area exposed. The analysis emphasizes the importance of considering both precipitation and evaporative demand, as their combined changes best explain regional variations in flash drought frequency. The findings are consistent with regional studies that report increasing flash drought risk and complexity tied to monsoon variability and suggest that land-use change (e.g., deforestation) may exacerbate intensification in some regions.
Conclusion
This work provides a global assessment of future flash drought frequency and cropland risk using a multivariate identification framework applied to six CMIP6 models across SSP126, SSP245, and SSP585. It shows robust increases in flash drought occurrence worldwide, stronger under higher-forcing pathways, and widespread growth in agricultural exposure, with particularly large increases in North America and Europe under SSP585. The study identifies increased evaporative demand as a dominant driver of rising flash drought frequency and intensification rates, with combined precipitation decreases and PET increases best explaining regional changes. These results underscore the benefits of lower-emissions pathways in reducing agricultural risk from flash drought and highlight regions most susceptible to frequent and intense events. Future research should examine region-specific atmospheric and oceanic drivers (teleconnections, wave patterns), interactions with land-use and land-cover change, and develop local-scale impact assessments and mitigation strategies tailored to projected shifts in flash drought characteristics.
Limitations
Key limitations include: (1) reliance on a limited set of six CMIP6 models constrained by data availability, which may not capture full model uncertainty; (2) sensitivity of flash drought identification to datasets, variable choices, and methodology, despite a multivariate approach and ensemble averaging; (3) PET estimation via the Penman–Monteith equation does not account for CO2 physiological effects, potentially overestimating drying; (4) uncertainties in land-use/land-cover projections (LUH2) that can affect regional climate feedbacks and exposure estimates; (5) ensemble averaging without individual bias correction avoids introducing unphysical trends but may smooth important local signals; (6) masking of arid/cold regions and seasonal identification windows may omit some events but was necessary to focus on environments with sufficient evaporative demand; and (7) reanalysis-model differences and internal variability introduce regional uncertainties, especially where precipitation projections are less certain (e.g., monsoon regions).
Listen, Learn & Level Up
Over 10,000 hours of research content in 25+ fields, available in 12+ languages.
No more digging through PDFs, just hit play and absorb the world's latest research in your language, on your time.
listen to research audio papers with researchbunny