
Food Science and TechnologyNature Food
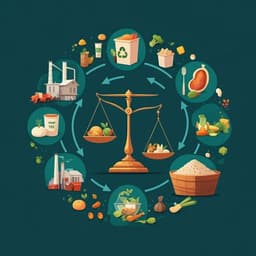
Forced labour risk is pervasive in the US land-based food supply
N. T. Blackstone, E. Rodríguez-huerta, et al.
This groundbreaking research quantitatively assesses the underestimated risk of forced labor in the US land-based food supply, revealing that animal-based proteins, processed fruits and vegetables, and discretionary foods are major contributors. Conducted by Nicole Tichenor Blackstone and colleagues, the study emphasizes the need for international collaboration to combat labor exploitation in our food systems.
Related Publications
Explore these studies to deepen your understanding
Adjacent work that informs or extends this paper's methodology and findings.
Food Science and Technology
A framework to quantify mass flow and assess food loss and waste in the US food supply chain
W. Dong, K. Armstrong, et al.

Environmental Studies and Forestry
Overcoming global inequality is critical for land-based mitigation in line with the Paris Agreement
F. Humpenöder, A. Popp, et al.

Environmental Studies and Forestry
Spatiotemporal dynamic evolution and driving factors of desertification in the Mu Us Sandy Land in 30 years
X. Han, G. Jia, et al.
Political Science
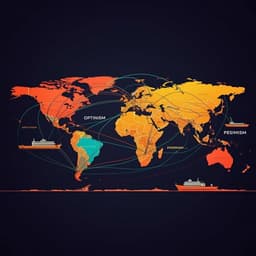
Discrepancies in the newsworthiness of maritime security in Chinese and US media outlets: a corpus-based discursive news values analysis
C. Chen and R. Liu


