Transportation
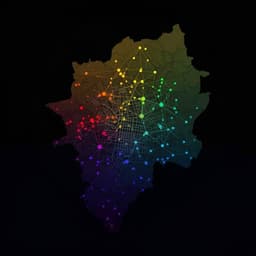
Estimating and modeling spontaneous mobility changes during the COVID-19 pandemic without stay-at-home orders
B. Zhao, X. Wang, et al.
This exciting research led by Baining Zhao and colleagues explores spontaneous mobility changes in Shenzhen following the end of the 'Zero-COVID' policy. With a robust analysis of 148 million travel data points, the study reveals significant spatial discrepancies in mobility patterns, providing crucial insights for future public health strategies against infectious diseases.
~3 min • Beginner • English
Introduction
COVID-19 has caused over 7 million deaths and trillions in economic losses, motivating research to inform responses to future highly infectious diseases. Urban areas, home to over half the global population, are particularly vulnerable due to density, making it critical to understand how urban mobility responds and recovers during pandemics. Prior work largely examined mobility changes driven by government-imposed restrictions; much less is known about spontaneous, voluntary mobility adjustments absent stay-at-home orders. China’s abrupt lifting of the Zero-COVID policy on December 7, 2022, and the rapid spread of Omicron created a natural experiment to observe unregulated mobility behavior under high infection with relatively low fatality. Using 148 million origin–destination (OD) trips in Shenzhen’s bus, subway, and taxi systems, the study asks: (Q1) How does urban mobility evolve temporally and spatially through a pandemic lifecycle? (Q2) How do mobility behaviors tied to different land-use purposes and transport modes respond? (Q3) Can a dynamic model infer citywide spatio-temporal mobility changes from purpose- and mode-specific behaviors? The authors quantify decline and recovery features, identify clusters of OD mobility patterns, map OD flows to urban land use (ULU) to infer travel purposes, and develop a dynamic UIR (usual–infectious–recovered) mobility model that integrates infection dynamics and travel willingness.
Literature Review
Existing studies emphasize the impact of government mandates (lockdowns, stay-at-home orders) on mobility and virus transmission, and the broader social, economic, and mental health consequences. Research has explored transport system adaptations and mobility network models for pandemic dynamics. However, evidence on voluntary, spontaneous mobility changes—without restrictive policies—is limited. Work on travel purpose inference via POIs/ULU and resilience concepts informs this study’s approach to quantifying decline and recovery and linking mobility patterns to land-use-driven purposes.
Methodology
Data: OD mobility data were collected by a Shenzhen public transport operator: 663 bus routes, 16 subway lines, and 17,826 taxis, totaling ~148 million trips. Bus OD tensor: (3010 origins × 3010 destinations × 98 days; Oct 15, 2022–Jan 6, 2023). Subway OD tensor: (240 × 240 × 67 days; Nov 1, 2022–Jan 6, 2023). Taxi trips were mapped to 11,362 urban regions (from a 2018 essential urban land use map augmented with recent POIs), yielding an OD tensor (11362 × 11362 × 67 days). Analysis focuses on Dec 8, 2022–Jan 6, 2023; pre-Dec 7 data establish baseline mobility and ULU spatial attractiveness.
Preprocessing: For each OD pair, the time series was smoothed with a Kalman filter to reduce noise. Normalization used the Dec 8, 2022 level as baseline for each OD series to highlight pandemic effects.
Feature engineering: To capture decline and recovery dynamics, the authors computed: declining speed, declining amplitude, trough duration, recovery speed, recovery amplitude, and total impact (area between time series and baseline), using the times and levels of pre-decline peak, trough, and final level.
Clustering: Features for all OD pairs across modes were clustered using K-means++ (K=4 chosen via elbow method and silhouette analysis) to identify distinct mobility change patterns.
ULU integration: For bus (200 m radius) and subway (500 m radius) stations, and taxi regions, ULU feature vectors captured spatial attractiveness across nine categories (residential, company, commercial service, transport hub, college, school, hospital, cultural/sport, park/scenery). For taxi regions, a single dominant ULU category defines the vector. OD purpose matrices were formed as outer products of origin and destination ULU vectors; aggregating by cluster identified dominant purpose pairs and their proportions.
Dynamic OD mobility model (UIR): Extends SIR logic to mobility states with three states per OD pair: Usual (U, uninfected and traveling as usual), Infectious (I, infected or panicking, reducing travel), and Recovered (R, resuming travel). The model couples: (1) physiological infection transitions with global transmission (β) and recovery (γ) rates; and (2) willingness influence transitions modulated by purpose- and mode-specific willingness factors for transmission and recovery. Willingness factors for origin–destination ULU pairs are modeled as normal distributions; OD-specific factors are composed as weighted sums via the OD ULU transition matrix and mode-level modifiers (bus, subway, taxi). The pre-pandemic OD flow Wij sets the population size; initial U, I, R are set from city-level initial infection. The model simulates daily U, I, R transitions and outputs trips as the time series of travelers.
Parameter estimation and validation: β and γ were set consistent with Omicron literature (β≈0.3, γ≈0.1). Willingness factor distribution parameters (means and SDs) were estimated via grid search and maximum likelihood to minimize RMSE between predicted and observed OD trips, focusing on dominant ULU pairs. The model was fit across bus, subway, and taxi OD pairs, generating 100 stochastic realizations by sampling willingness parameters. Sensitivity analysis varied β and γ by ±30% and measured RMSE impact.
Key Findings
- Spatial heterogeneity: Mobility in central business districts (CBDs) and adjacent areas experienced larger declines and slower recoveries than peripheral areas when analyzed at 1 km grids.
- Four mobility clusters (OD-level patterns across modes):
• Cluster 1: Largest decline and prolonged trough. Average metrics: declining speed −0.0420 %/day; declining amplitude 65.7%; trough duration 14 days; negligible recovery speed; total impact −13.47 %-days. Interpreted as flexible or highly risk-averse trips with slow recovery.
• Cluster 2: Pronounced U-shape with gradual recovery. Metrics: declining speed −0.0349 %/day; declining amplitude 51.6%; trough duration 4 days; recovery speed 0.0376 %/day; recovery amplitude 48.8%; total impact −8.39 %-days. Mirrors infection and recovery dynamics, representative of majority behavior.
• Cluster 3: U-shape with rapid rebound. Metrics: declining speed −0.0328 %/day; declining amplitude 48.8%; trough duration 4 days; recovery speed 0.0261 %/day; recovery amplitude 33.8%; total impact −7.26 %-days. Near return to baseline by period end.
• Cluster 4: Minimal impact. Metrics: declining speed −0.0264 %/day; declining amplitude 38.2%; trough duration 6 days; recovery speed 0.0195 %/day; recovery amplitude 27.2%; total impact −5.91 %-days. Inelastic demand.
- Travel purpose associations (via ULU):
• Schools/colleges: Concentrated in Clusters 1–2; sharp declines and slow recovery due to risk aversion and remote learning.
• Recreation (parks/scenery, cultural/sports): Deemed non-essential; large declines and slow recovery (Clusters 1–2); reduced bus use by older groups and post-infection fatigue contributed to slower rebound.
• Transport hubs (airports, rail, ferry): Smaller reductions and faster recovery (Clusters 3–4) due to limited substitutes for long-distance trips.
• Residential–hospital: Modest declines with gradual recovery within ~30 days; increased infectious disease demand and essential staff commuting maintained >40% trip rate.
• Residential–company (commuting) and commercial services: Relatively less affected; key drivers of recovery. Heterogeneity tied to industry on-site requirements and income-related mode shifts.
- Mode impacts (total impact on volumes): Subway −9.42 %-days (most affected), bus −8.63 %-days, taxi −7.90 %-days (least affected). Differences align with perceived transmission risk and adaptability, and with taxis’ more individualized environment.
- Model performance: The UIR model with willingness factors closely fit OD-level time series across bus, subway, and taxi, and reproduced cluster-average dynamics. Willingness-for-recovery was the primary driver of heterogeneity (e.g., strongly negative for school-related travel; highly positive for transport-hub-related travel). Sensitivity: a 1% deviation in β increased prediction error by ~0.61%; a 1% deviation in γ increased error by ~0.77%.
Discussion
The study addresses Q1 by quantifying temporal decline–trough–recovery dynamics and mapping spatial disparities, showing CBDs suffered greater impacts. For Q2, integrating OD flows with ULU reveals purpose-specific behaviors: essential trips (commuting, healthcare, long-distance transfers) were more resilient, while educational and recreational trips showed large voluntary reductions and slow rebounds. Modal differences reflect perceived infection risk and substitutability. For Q3, the UIR model combining infection dynamics with willingness factors, constructed from ULU-derived purposes and transport modes, accurately reproduces fine-grained OD mobility changes and cluster-level averages. These findings demonstrate that even absent government restrictions, population behavior induces substantial, heterogeneous mobility changes aligned with infection and recovery cycles and perceived risk. Policy relevance includes maintaining and prioritizing services linking communities, hospitals, companies, and transport hubs; using the model as a benchmark for evaluating interventions’ opportunity costs and effects on transmission and productivity; and targeting willingness (risk perception) via hygiene, ventilation, and service adjustments to influence recovery trajectories.
Conclusion
Using 148 million OD trips from bus, subway, and taxi in Shenzhen during the abrupt cessation of Zero-COVID, the paper quantifies spontaneous mobility decline and recovery, links OD patterns to land-use-defined travel purposes, and introduces a dynamic UIR model with willingness factors that fits fine-grained mobility across modes. Contributions include: (1) a resilience-inspired feature set capturing mobility decline–trough–recovery, (2) discovery of four robust OD mobility patterns with clear purpose associations, and (3) a parsimonious, generalizable model that fuses infection dynamics and willingness to explain heterogeneous mobility responses at sub-500 m granularity. Future work includes extending datasets to additional modes and cities, incorporating spatial heterogeneity of epidemic spread, integrating richer behavioral data and large language model-driven agent simulations, and examining interdependencies with urban systems such as air quality, unmanned delivery, and emergency communications.
Limitations
Data cover only three public transport modes and exclude private modes (e.g., private cars, cycling, walking). The UIR model is minimalist and assumes citywide β and γ, omitting spatial variation in epidemic spread and contact structure. Purpose inference via ULU and POIs may introduce classification noise. Normalization choices and short observation windows may limit generalizability of long-run recovery dynamics.
Related Publications
Explore these studies to deepen your understanding of the subject.

