
Drug classification with a spectral barcode obtained with a smartphone Raman spectrometer
U. J. Kim, S. Lee, et al.
Explore these studies to deepen your understanding
Adjacent work that informs or extends this paper's methodology and findings.

Evaluating a brief smartphone-based stress management intervention with heart rate biofeedback from built-in sensors in a three arm randomized controlled trial
L. M. Fuhrmann, C. A. Lukas, et al.
A new microchannel capillary flow assay (MCFA) platform with lyophilized chemiluminescence reagents for a smartphone-based POCT detecting malaria
S. Ghosh, K. Aggarwal, et al.

Addressable nanoantennas with cleared hotspots for single-molecule detection on a portable smartphone microscope
K. Trofymchuk, V. Glembockyte, et al.
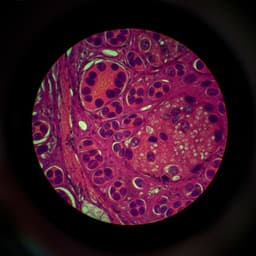
Effectiveness of transfer learning for enhancing tumor classification with a convolutional neural network on frozen sections
Y. Kim, S. Kim, et al.


