Environmental Studies and ForestryNature Communications
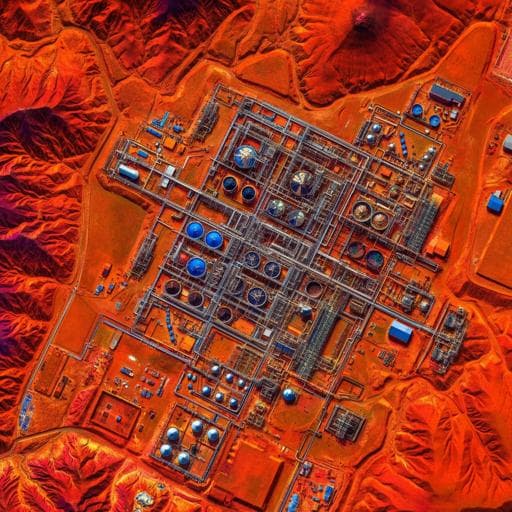
Deep learning for detecting and characterizing oil and gas well pads in satellite imagery
N. Ramachandran, J. Irvin, et al.
This research, conducted by Neel Ramachandran, Jeremy Irvin, Mark Omara, Ritesh Gautam, Kelsey Meisenhelder, Erfan Rostami, Hao Sheng, Andrew Y. Ng, and Robert B. Jackson, presents a groundbreaking deep learning approach to mapping oil and gas infrastructure using high-resolution satellite imagery, revealing previously unmapped well pads and storage tanks in key basins.
Related Publications
Explore these studies to deepen your understanding
Adjacent work that informs or extends this paper's methodology and findings.
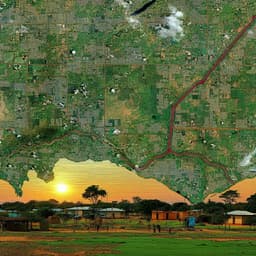
Economics
Using publicly available satellite imagery and deep learning to understand economic well-being in Africa
C. Yeh, A. Perez, et al.
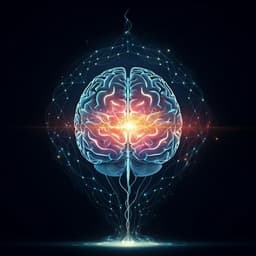
Medicine and Health
A multimodal deep learning approach for the prediction of cognitive decline and its effectiveness in clinical trials for Alzheimer’s disease
C. Wang, H. Tachimori, et al.
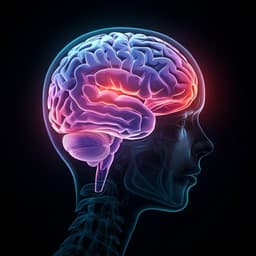
Medicine and Health
A clinically applicable deep-learning model for detecting intracranial aneurysm in computed tomography angiography images
Z. Shi, C. Miao, et al.
Physics
An unsupervised deep learning algorithm for single-site reconstruction in quantum gas microscopes
A. Impertro, J. F. Wienand, et al.


