Environmental Studies and Forestry
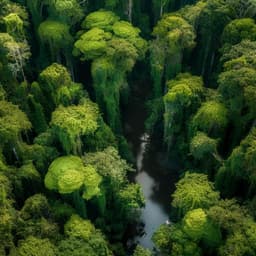
Anthropogenic modification of forests means only 40% of remaining forests have high ecosystem integrity
H. S. Grantham, A. Duncan, et al.
Discover the alarming state of global forests in this crucial study conducted by a team of experts including H. S. Grantham and A. Duncan. With only 40.5% of forests maintaining high ecological integrity, urgent policy changes are essential to combat human pressures and connectivity loss affecting these vital ecosystems.
~3 min • Beginner • English
Introduction
The paper addresses how much of the world’s remaining forests retain high ecosystem integrity, recognizing that deforestation metrics alone overlook pervasive anthropogenic modification that degrades structure, composition, and function. The authors emphasize ecosystem integrity as foundational to the Rio Conventions (UNFCCC, UNCCD, CBD) and critical for delivering benefits such as climate regulation and biodiversity support. Although satellite-era advances have mapped forest extent and loss, consistent global monitoring of the degree of forest modification has lagged due to challenges detecting low-intensity or sub-canopy disturbances and the diversity of human pressures. Prior global products (e.g., Intact Forest Landscapes, wilderness) classify areas in binary terms and do not resolve gradients of modification. The study’s purpose is to develop a global, spatially explicit, continuous index of forest condition based on anthropogenic modification by integrating observed human pressures, inferred pressures (edge effects and associated processes), and loss of landscape connectivity. The authors aim to benchmark integrity, compare across biogeographic realms and countries, and inform policy and management to help meet SDGs and biodiversity/climate commitments.
Literature Review
The authors situate their work among global assessments of forest extent and change using remote sensing (e.g., Hansen et al. global tree cover and loss), proxies for human pressure such as the Human Footprint, and binary intactness maps (Intact Forest Landscapes, wilderness areas). They note emerging global indicators of canopy cover/height, fragmentation, and various mapped human pressures, but emphasize the lack of a unified, continuous measure of forest modification that integrates multiple scales of influence (local pressures, diffuse edge effects, and connectivity changes). Previous studies often quantify these pressures individually or use categorical intactness, which miss gradients in condition and subtle yet widespread degradation under the canopy. The authors’ approach builds on and adapts methods like the Human Footprint for pressure scaling and integrates connectivity modeling to capture landscape-scale configuration effects, aiming to provide a more nuanced depiction of forest condition.
Methodology
Overview: The Forest Landscape Integrity Index (FLII) is a globally consistent, continuous index (scale 0–10; higher = higher integrity) computed at 300 m resolution in Google Earth Engine for conditions at the start of 2019. Three components are integrated: (1) observed human pressures, (2) inferred pressures (edge effects and associated processes decaying with distance), and (3) loss of forest connectivity. Results can be categorized into illustrative integrity classes: high (≥9.6), medium (≥6.0 and <9.6), and low (≤6.0).
Data and preprocessing:
- Forest extent (2019): Derived from the 2000 Global Tree Cover product with annual Tree Cover Loss 2001–2018 subtracted, following Curtis et al. categories to retain likely dense canopy forests while accounting for shifting cultivation and rotational forestry considerations. The final forest mask defines pixels for integrity scoring (binary forest/non-forest).
Observed pressures (local, directly mapped):
- Components: infrastructure (e.g., roads, settlements, extractive access), agriculture, and tree cover loss (canopy loss) for 2001–2018.
- Combination: Components with non-commensurate units are scaled using exponentiation (adapting the Human Footprint methodology) and summed to produce a positive observed pressure score P per pixel: P = exp(a) + exp(b) + exp(c), where a, b, c are standardized intensities for infrastructure, agriculture, and canopy loss respectively. This ensures sensitivity across the range of each input.
Inferred pressures (edge effects and diffuse processes):
- Rationale: Captures processes not directly mapped globally (e.g., microclimate changes at edges, selective logging, fuelwood collection, hunting, livestock grazing, invasive species, pollution), which tend to be spatially associated with observed pressures and decline with distance.
- Short-range effects: Exponential distance-decay from source pixels with observed pressure, approaching zero by ~3 km and truncated at 5 km. Weights are normalized so the sum across pixels in range equals approximately 1.85.
- Long-range effects: Uniform, weaker influence within a larger radius up to 12 km around sources, with weights normalized to sum ~1.05. The aggregate inferred pressure for a focal pixel is the sum of normalized, distance-weighted contributions from surrounding pixels with observed pressure.
Loss of forest connectivity (landscape configuration):
- Connectivity metric Ci computed using a Gaussian kernel (σ ≈ 20 km; truncated at a finite distance) to quantify surrounding forest amount/configuration for each pixel based on the current forest map (Current Configuration, CC).
- Potential Configuration (PC) represents expected forest connectivity without anthropogenic fragmentation (derived from potential natural extent/resampled spatial analysis). Lost Forest Configuration (LFC) is computed as LFC = 1 − (CC/PC), bounded to avoid spurious increases due to PC inaccuracies (values near 0 indicate little loss; values near 1 indicate high loss).
Index calculation and scaling:
- The three components (observed pressure P, inferred pressure Q, and LFC) increase with modification. The FLII is constructed so higher values indicate higher integrity by transforming and combining components, then scaling to 0–10. Forest pixels with no detectable modification score 10; those most modified approach 0. Scores are continuous but discretized for summaries into: low (≤6.0), medium (6.0–<9.6), high (≥9.6), benchmarked against reference locations.
Analytical environment and summaries:
- All computations were performed in Google Earth Engine at 300 m resolution with globally consistent parameters. Results were summarized by biogeographic realms and countries. Protected area analyses used IUCN categories to assess integrity distributions within nationally designated protected areas and to compare the proportion of high-integrity forest that falls within protected areas.
Classification for communication:
- High integrity: interiors/natural edges of largely undisturbed, naturally regenerated forests dominated by native species with intact functions.
- Medium integrity: fragmented or moderately modified forests with some edge effects, moderate resource extraction, and partial function loss.
- Low integrity: heavily modified forests, frequent stand-replacing events, non-native species presence, and substantial function loss.
Key Findings
- Global extent of high-integrity forest: Only 17.4 million km² (40.5%) of remaining forests have high landscape-level integrity (FLII ≥ 9.6), concentrated mainly in Canada, Russia, the Amazon/Guianas, Central Africa, and New Guinea.
- Medium/low integrity dominance: 59% (≈25.6 million km²) of remaining forests have medium or low integrity; about 25.6% (≈11 million km²) are low integrity (FLII ≤ 6.0).
- Global average integrity: Mean FLII score globally is 7.76 (medium integrity).
- Observed and inferred pressures: 31.26% of forests are experiencing observed human pressures (infrastructure, agriculture, tree cover loss). Inferred pressures and connectivity impacts occur in 91.2% of forests (often at low levels), indicating pervasive diffuse modification.
- Geographic patterns: High-integrity forests dominate in boreal North America (northern Canada, Alaska) and parts of the Neotropics (Amazon, Guianas), Central Africa (Congo Basin, Gabon), and New Guinea, with scattered tracts in Sumatra, Borneo, Myanmar, and parts of the Greater Mekong. Low-integrity concentrations are notable in West/Central Europe, southeastern USA, much of China and India, the Andes, island/mainland SE Asia west of New Guinea, the Albertine Rift, West Africa, Mesoamerica, and the Brazilian Atlantic Forest.
- Protected areas (PAs): Only 2% of the global high-integrity forest area is in globally designated protected areas. Overall, 26.1% of all high-integrity forest falls within protected areas, versus 18.5% of medium and 13.1% of low integrity forests. Within nationally designated protected forests (~1.3 billion ha), 52.8% are high integrity, 30.3% medium, and 16.8% low, indicating nearly half of forests inside PAs are already fairly modified.
Discussion
The integrated, continuous FLII reveals that extensive anthropogenic modification pervades remaining forests beyond outright deforestation, with significant implications for biodiversity, climate regulation, and other ecosystem services. Indices based solely on forest extent underestimate degradation impacts; incorporating observed pressures, diffuse edge effects, and connectivity loss provides a more realistic picture of forest condition across biogeographic realms and countries. The findings underscore the urgency of retention strategies for the most intact forests, which deliver disproportionate ecological benefits and resilience. Preventing integrity loss is more effective and less risky than restoration after degradation. Policies should identify, formally recognize, and prioritize high-integrity areas in spatial planning and management (e.g., protected areas, other effective area-based conservation measures, and Indigenous-managed lands), and shield them from industrial development. The FLII can guide such decisions and can be adapted with local data and weights to improve precision and ownership at national/subnational scales. The prevalence of medium and low integrity within protected areas also highlights the need to improve management effectiveness and address pressures within PA networks.
Conclusion
This study presents the first globally consistent, continuous index of forest landscape integrity that integrates observed human pressures, inferred edge-related effects, and connectivity loss at 300 m resolution. Results show that only about 40% of remaining forests retain high integrity, with the majority moderately or heavily modified, and only a small fraction of high-integrity areas under global protection. The framework advances beyond binary intactness maps, enabling nuanced comparisons and policy-relevant prioritization. Future work should add temporal dynamics to track change, incorporate additional globally coherent drivers (e.g., invasive species, governance effectiveness), refine fire attribution, and tailor parameters with local datasets through scalable tools. Policymakers should adopt retention-focused strategies alongside restoration efforts to safeguard remaining high-integrity forests and enhance integrity where feasible.
Limitations
- Detection limits: Low-intensity, unevenly distributed, and sub-canopy modifications (e.g., selective logging, overhunting) are difficult to detect consistently with global datasets.
- Fire treatment: Inability to reliably separate anthropogenic from natural fires globally led to a conservative approach, treating fire-dominated canopy loss as low-risk/temporary in some contexts, potentially underestimating human-driven degradation, especially where fire regimes have been altered.
- Temporal scope: The index reflects conditions at the start of 2019 using loss data since 2001; modifications prior to 2000 (e.g., historical logging) may be underrepresented.
- Driver coverage: Some important drivers (invasive species, pollution, hydrological alterations, climate change impacts) lack globally coherent data and are only indirectly captured via correlation with observed pressures.
- Modeling assumptions: Inferred pressure uses distance-decay functions and uniform long-range weights based on expert judgment; alternative parameterizations or context-specific calibration could change local estimates.
- Connectivity baseline: Estimation of Potential Configuration (PC) involves assumptions and resampling; although bounded, inaccuracies can influence LFC.
- Plantations and non-natural forests: Where plantations and planted forests are included in the forest mask, integrity may be over- or under-estimated without high-resolution plantation maps, though inspection suggests most planted forests receive lower integrity scores due to associated infrastructure and canopy replacement.
- Governance and management effectiveness: Not explicitly modeled; contexts with strong management (e.g., well-managed PAs, community lands) may experience reduced impacts relative to pressures.
- Protected area designations: Global vs. national PA coverage statistics may differ; some PAs are represented as points and excluded from certain analyses, potentially biasing totals.
Related Publications
Explore these studies to deepen your understanding of the subject.

