
Engineering and TechnologyMicrosystems & Nanoengineering
Widely accessible method for 3D microflow mapping at high spatial and temporal resolutions
E. Lammertse, N. Koditala, et al.
Discover a groundbreaking method for mapping micro-flows in 3D at high resolution, developed by Evan Lammertse and colleagues. This innovative approach utilizes brightfield microscopy and open-source software to visualize and control fluids at the microscale, enhancing the design of microfluidic structures.
Related Publications
Explore these studies to deepen your understanding
Adjacent work that informs or extends this paper's methodology and findings.
Social Work
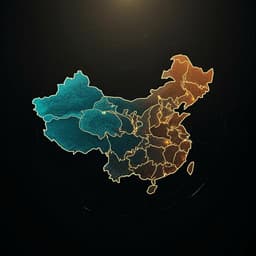
Spatial and temporal changes in population distribution and population projection at county level in China
M. Sang, J. Jiang, et al.

Agriculture
PH13 improves soybean shade traits and enhances yield for high-density planting at high latitudes
C. Qin, Y. Li, et al.
Engineering and Technology
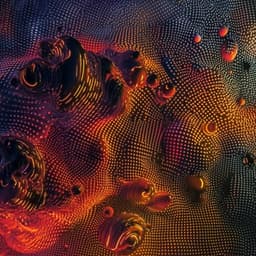
Halftone spatial frequency domain imaging enables kilohertz high-speed label-free non-contact quantitative mapping of optical properties for strongly turbid media
Y. Zhao, B. Song, et al.
Medicine and Health
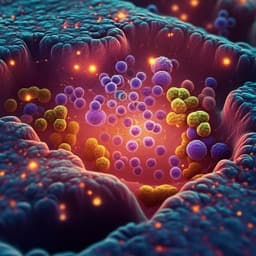
High resolution mapping of the tumor microenvironment using integrated single-cell, spatial and in situ analysis
A. Janesick, R. Shelansky, et al.


