
Sustainable healthy diet modeling for a plant-based dietary transitioning in the United States
R. Aidoo, V. Abe-inge, et al.
Explore these studies to deepen your understanding
Adjacent work that informs or extends this paper's methodology and findings.
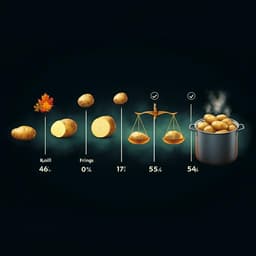
Nutritional-environmental trade-offs in potato storage and processing for a sustainable healthy diet
A. Payne, E. M. Kwofie, et al.

The translational lag narrative in policy discourse in the United States and the European Union: a comparative study
E. Aarden, L. Marelli, et al.

Emotional adaptation during a crisis: decline in anxiety and depression after the initial weeks of COVID-19 in the United States
A. Shuster, M. O'brien, et al.

A Multicenter Randomized Controlled Trial of Microbiome-Based Artificial Intelligence-Assisted Personalized Diet vs Low-Fermentable Oligosaccharides, Disaccharides, Monosaccharides, and Polyols Diet: A Novel Approach for the Management of Irritable Bowel Syndrome
V. Tunali, N. Ç. Arslan, et al.


