
Interdisciplinary StudiesNature Methods
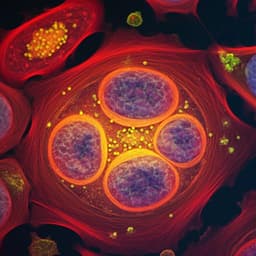
Super-resolution microscopy reveals that energy transfer between fluorophores at distances <10 nm speeds up photoswitching kinetics
D. A. H, G. B, et al.
In an exploration of fascinating findings, this research, conducted by D. A. H, G. B, M. M, D. T, A. K, M. Streit, S. D, and M. Sauer, promises to unravel innovative concepts that will engage your curiosity and encourage deeper investigation into the subject matter.
Related Publications
Explore these studies to deepen your understanding
Adjacent work that informs or extends this paper's methodology and findings.

Chemistry
High-performance near-infrared OLEDs maximized at 925 nm and 1022 nm through interfacial energy transfer
C. Hung, S. Wang, et al.

Physics
Machine learning assisted quantum super-resolution microscopy
Z. A. Kudyshev, D. Sychev, et al.
Biology
High-dimensional super-resolution imaging reveals heterogeneity and dynamics of subcellular lipid membranes
K. Zhanghao, W. Liu, et al.
Biology
Deep learning enables reference-free isotropic super-resolution for volumetric fluorescence microscopy
H. Park, M. Na, et al.


