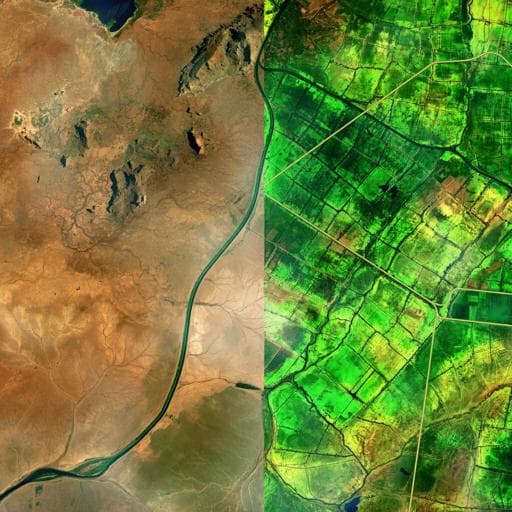
Societal drought vulnerability and the Syrian climate-conflict nexus are better explained by agriculture than meteorology
L. Eklund, O. M. Theisen, et al.
Explore these studies to deepen your understanding
Adjacent work that informs or extends this paper's methodology and findings.

Dopamine release and dopamine-related gene expression in the amygdala are modulated by the gastrin-releasing peptide in opposite directions during stress-enhanced fear learning and extinction
Y. Morishita, I. Fuentes, et al.

Dopamine release and dopamine-related gene expression in the amygdala are modulated by the gastrin-releasing peptide in opposite directions during stress-enhanced fear learning and extinction
Y. Morishita, I. Fuentes, et al.

Veganuary and the vegan sausage (t)rolls: conflict and commercial engagement in online climate-diet discourse
M. Sanford and J. Lorimer

What do climate impacts, health, and migration reveal about vulnerability and adaptation in the Marshall Islands?
D. Krzesni and L. Brewington


