Health and FitnessHumanities & Social Sciences Communications
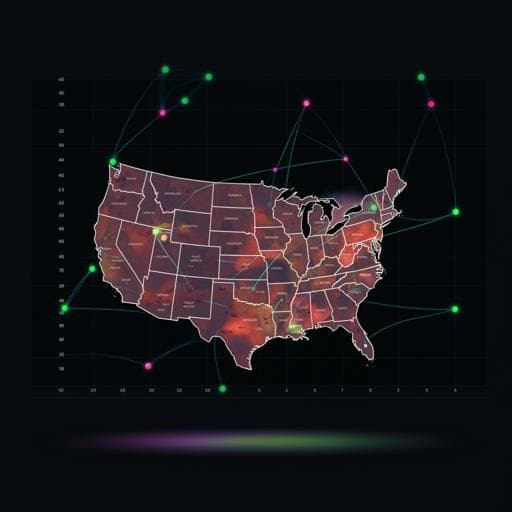
Social vulnerability amplifies the disparate impact of mobility on COVID-19 transmissibility across the United States
B. Huang, Z. Huang, et al.
This study, conducted by Bo Huang and team, reveals the critical impact of social vulnerability on COVID-19 transmission rates in U.S. counties during the summer of 2020. It highlights that socially vulnerable areas faced nearly double the transmission related to mobility, emphasizing the urgent need for targeted social distancing measures.
Related Publications
Explore these studies to deepen your understanding
Adjacent work that informs or extends this paper's methodology and findings.

Medicine and Health
Impact of COVID-19 on Pregnancy Outcomes across Trimesters in the United States
S. Virk, K. Gan, et al.

Medicine and Health
Prediction of COVID-19 Social Distancing Adherence (SoDA) on the United States county-level
M. Ingram, A. Zahabian, et al.

Biology
Impact of pesticide use on wild bee distributions across the United States
L. M. Guzman, E. Elle, et al.

Sociology
Empirical evidence of the impact of mobility on property crimes during the first two waves of the COVID-19 pandemic
K. Paramasivan, R. Subburaj, et al.


