Earth SciencesCommunications Earth & Environment
Return to rapid ice loss in Greenland and record loss in 2019 detected by the GRACE-FO satellites
I. Sasgen, B. Wouters, et al.
Greenland's ice loss has surged to alarming levels, reaching a staggering 532 ± 58 Gt yr⁻¹ in 2019, eclipsing even the notorious 2012 record. This study, conducted by Ingo Sasgen, Bert Wouters, Alex S. Gardner, Michalea D. King, Marco Tedesco, Felix W. Landerer, Christoph Dahle, Himanshu Save, and Xavier Fettweis, sheds light on the recent fluctuations in melt rates and their implications for global sea level rise.
Related Publications
Explore these studies to deepen your understanding
Adjacent work that informs or extends this paper's methodology and findings.

Earth Sciences
Important role of stratosphere-troposphere coupling in the Arctic mid-to-upper tropospheric warming in response to sea-ice loss
M. Xu, W. Tian, et al.
Environmental Studies and Forestry
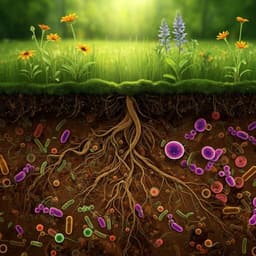
Rapid differentiation of soil and root microbiomes in response to plant composition and biodiversity in the field
H. M. Burrill, G. Wang, et al.

Earth Sciences
Ice acceleration and rotation in the Greenland Ice Sheet interior in recent decades
A. Løkkegaard, W. Colgan, et al.

Food Science and Technology
A framework to quantify mass flow and assess food loss and waste in the US food supply chain
W. Dong, K. Armstrong, et al.


