logo
ResearchBunny Logo
Responses of plant diversity to precipitation change are strongest at local spatial scales and in drylands

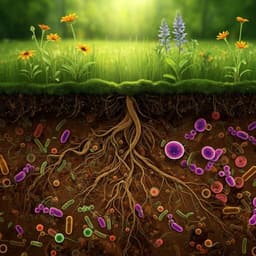
Environmental Studies and Forestry

Responses of plant diversity to precipitation change are strongest at local spatial scales and in drylands

L. Korell, H. Auge, et al.

Discover how changes in precipitation impact plant diversity, especially in dry environments. This compelling study by Lotte Korell, Harald Auge, Jonathan M. Chase, W. Stanley Harpole, and Tiffany M. Knight reveals that even small alterations in precipitation can lead to significant shifts in biodiversity, emphasizing the need for awareness regarding the fragility of dryland ecosystems in the face of climate change.

00:00
00:00
~3 min • Beginner • English
Introduction
The study addresses how changes in precipitation associated with human-caused climate change influence plant biodiversity across ecosystems. Prior syntheses of precipitation manipulation experiments have often detected no overall effect on biodiversity, partly because standard meta-analyses of reported effect sizes may miss scale-dependent responses and the roles of abundance, evenness, and spatial aggregation. The authors hypothesize that biodiversity responses depend on (i) the magnitude and direction of precipitation manipulation, (ii) spatial grain (local plot to site and turnover scales), and (iii) background climatic conditions (e.g., ambient precipitation and aridity). They expect stronger responses with larger manipulation magnitudes, potential asymmetries between increases and decreases in precipitation, scale-dependent effects due to changes in abundance and composition, and stronger biodiversity responses in drier ecosystems where water limitation is greatest. To test these ideas, they compile primary plot-level abundance data from precipitation manipulation experiments worldwide and analyze species richness and evenness responses across spatial scales, accounting for background climate.
Literature Review
Previous meta-analyses and syntheses (e.g., Yue et al. 2020; Komatsu et al. 2019) have reported no overall effect of precipitation additions on plant biodiversity, but these approaches may not capture complex, scale-dependent biodiversity responses. Biodiversity responses often vary with spatial grain due to underlying changes in abundance, dominance, and spatial turnover. Productivity in dry ecosystems tends to be more responsive to precipitation than in less water-limited systems, yet productivity is a poor predictor of species richness, suggesting biodiversity changes may not mirror productivity responses. Methodological differences between precipitation increase and decrease experiments can also introduce non-linearities or artifacts. The authors highlight the need for syntheses that explicitly consider manipulation magnitude and direction, multiple biodiversity components across scales, and background climate (e.g., mean annual precipitation or potential evapotranspiration).
Methodology
Systematic literature searches in Web of Science and Google Scholar used terms encompassing precipitation change, biodiversity, plant communities, and climate manipulation experiments. Approximately 1700 studies were screened by title and abstract, with references of relevant papers and reviews yielding 20 additional studies. Inclusion criteria required field experiments in terrestrial ecosystems that manipulated precipitation and reported plot-level species abundances (cover, biomass, or point intercept). Greenhouse, pot, mesocosm, and small-scale seeding/weeding experiments were excluded. Of 139 potentially appropriate studies, those with only functional group data were excluded; authors were contacted for data when not publicly available. The final dataset comprised 72 precipitation manipulation experiments across 34 plant communities from 23 studies, primarily in North America and Europe, spanning mean annual precipitation from 225 to 1574 mm yr−1. For each experiment, the authors extracted location, duration (years), and precipitation manipulation magnitude relative to mean annual precipitation (%). Climate variables (MAP, PET) were sourced from the Chelsa database. When communities were monitored across years or seasons, the endpoint at peak biomass was used. Response variables and scales: (1) total plant abundance/cover per plot (where available); (2) species richness S at local (plot) scale (average per plot within treatment) and site (treatment) scale (combined species per treatment/site, rarefied to the minimum number of replicates, n=3; regional area 0.4–38 m²; plot size 0.08–2.5 m²); (3) evenness/dominance via Hurlbert’s PIE converted to effective number of species S_PIE (ENSPIE = 1/∑ p_i^2), calculated at local and site scales; and (4) turnover scale via the ratio of site to local diversity (equivalent to Whittaker’s beta for S and analogous for S_PIE), capturing spatial heterogeneity among plots within treatments. Effect sizes were computed as log response ratios (LRR = ln(treatment) − ln(control); positive indicates increase due to treatment). Statistical analyses used linear mixed-effects models with hierarchical random effects (block for local and turnover scales when applicable, site, study) to account for non-independence and design differences. Fixed effects included experiment duration (years), magnitude of precipitation manipulation (ΔP, %), and background climate (MAP; PET in alternative models). All covariates were scaled to mean and two standard deviations. Model selection used AICc; mean effect sizes and 95% CIs were bootstrapped (1000 iterations). Non-linearity and asymmetry were tested via quadratic ΔP terms and ΔP × direction interactions. Additional analyses assessed life history (dominant species monocarpic vs. polycarpic) in relation to MAP/PET and whether life history influenced biodiversity responses, using mixed-effects logistic regression and mixed-effects models. Sensitivity analyses considered plot size as a random effect and weighting by sqrt(sample size; results unchanged). Co-dependencies among effect size variance, plot size, and sample size were inspected; removal of influential studies did not qualitatively change results.
Key Findings
- Across both local (plot) and site scales, species richness decreased with experimental precipitation reductions and increased with precipitation additions. Conditional R^2: local cR^2 = 0.14; site cR^2 = 0.29. - Higher precipitation treatments increased evenness among common species (effective number of species S_PIE) at the local scale (cR^2 = 0.13), with effects attenuated at larger spatial grains. - Larger biodiversity changes at smaller spatial grains were associated with increases in total plant cover (cR^2 = 0.21). - At the turnover (plot-to-plot) scale, weaker effects of precipitation manipulation at larger grains were linked to declining variability in the shape of species abundance distributions between low vs. higher precipitation treatments, reflected by negative effect sizes for S_PIE with increased precipitation (cR^2 = 0.14). - Limited evidence for non-linear relationships or strong asymmetry between precipitation increases vs. decreases; direction did not significantly alter slopes for most responses. - Climate dependence: Richness responses to manipulation were steeper in drier environments at both local and site scales (interaction with MAP significant; local cR^2 = 0.16; site cR^2 = 0.30). Stronger local-scale richness responses in dry sites were primarily associated with stronger changes in total cover (cR^2 = 0.24). - Using PET instead of MAP yielded similar patterns; PET significantly modified the slope of local-scale S_PIE (cR^2 = 0.14), with high-PET ecosystems more strongly affected by precipitation treatments. - Life history: Sites with higher PET had a higher probability that the dominant species was monocarpic (Chisq = 11.7, P < 0.001), but communities dominated by monocarpic vs. polycarpic species did not differ in biodiversity response magnitudes (all P > 0.10). - Geographic/biome coverage was limited in wetter/colder systems (tropical/subtropical and tundra), contributing to greater certainty for dry and warm ecosystems than for others. - Overall explained variance was modest (cR^2 typically ~0.10–0.30), similar to globally distributed experiments (e.g., NutNet).
Discussion
The synthesis demonstrates that plant biodiversity responds to precipitation manipulations in a scale- and environment-dependent manner. Increases in precipitation tend to elevate species richness and evenness locally, likely through enhanced establishment opportunities, particularly in dryland systems where open microsites and water limitation constrain recruitment. Conversely, precipitation reductions in drylands likely increase mortality and reduce richness. At larger spatial scales, community responses are tempered, partly due to reduced plot-to-plot variability in the dominance structure under higher precipitation. The stronger sensitivity in dry ecosystems underscores their vulnerability to altered precipitation regimes under climate change. Accounting explicitly for spatial grain and manipulation magnitude was necessary to detect these context-dependent effects, explaining why prior meta-analyses that did not incorporate these factors often found no overall effects. Although the models explain a modest fraction of variance, the consistent patterns across scales and climates provide actionable insights for ecosystem management, indicating that drylands may require targeted conservation and management to buffer biodiversity against changing precipitation patterns.
Conclusion
This study synthesizes primary plot-level data from 72 precipitation manipulation experiments to show that biodiversity responses to precipitation change: (i) increase with the magnitude of manipulation, regardless of direction; (ii) are strongest at small (local) spatial scales; and (iii) are amplified in drier environments. Explicit consideration of spatial grain, manipulation magnitude, and background climate reveals significant, context-dependent biodiversity responses that prior syntheses often missed. The findings highlight dryland ecosystems as particularly sensitive to precipitation changes, with implications for conservation and management given their extent, unique biodiversity, and ecosystem services. Future research should implement distributed, standardized experiments across underrepresented biomes (e.g., tropical/subtropical and tundra systems), measure and report additional ecological and environmental covariates (e.g., soils, biotic interactions), and continue scale-explicit analyses to refine predictions of biodiversity responses to climate change.
Limitations
- Modest explained variance (conditional R^2 typically ~0.10–0.30) indicates important unmeasured factors (e.g., soil properties, biotic interactions, site history) influence biodiversity responses. - Biomeal coverage is uneven, with limited representation of wetter/colder ecosystems (tropical/subtropical systems and tundra), reducing generalizability beyond dry and warm regions. - Methodological heterogeneity among experiments (e.g., different structures for increasing vs. decreasing precipitation) could introduce artifacts, though analyses found limited evidence that direction altered slopes. - Some datasets lacked certain measurements (e.g., total cover in 4 of 23 studies), potentially constraining specific analyses. - Analyses focused on endpoint (peak biomass) responses; temporal dynamics and legacies may not be fully captured. - Plot and sample size varied among studies; although sensitivity checks suggest robustness, residual confounding cannot be ruled out.
Listen, Learn & Level Up
Over 10,000 hours of research content in 25+ fields, available in 12+ languages.
No more digging through PDFs, just hit play and absorb the world's latest research in your language, on your time.
listen to research audio papers with researchbunny