Environmental Studies and ForestryNature Climate Change
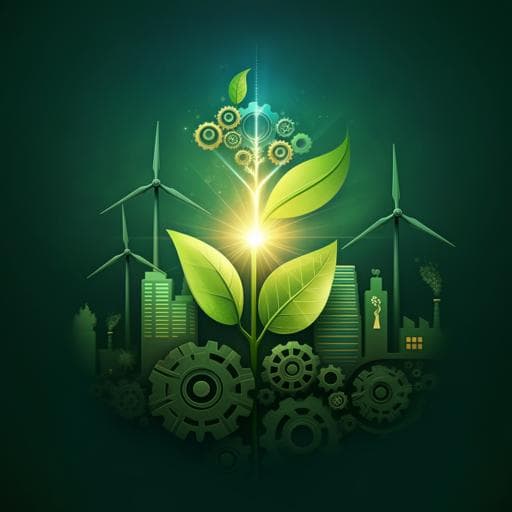
Reducing sectoral hard-to-abate emissions to limit reliance on carbon dioxide removal
O. Y. Edelenbosch, A. F. Hof, et al.
This research by Oreane Y. Edelenbosch and colleagues explores the critical role of carbon dioxide removal technologies in achieving net-zero greenhouse gas targets, highlighting the potential to reduce emissions in hard-to-abate sectors. Discover how demand and technological interventions could dramatically lower dependence on bioenergy with carbon capture and storage.
Related Publications
Explore these studies to deepen your understanding
Adjacent work that informs or extends this paper's methodology and findings.

Environmental Studies and Forestry
Over-reliance on land for carbon dioxide removal in net-zero climate pledges
K. Dooley, K. L. Christiansen, et al.

Environmental Studies and Forestry
Carbon emissions cap or energy technology subsidies? Exploring the carbon reduction policy based on a multi-technology sectoral DSGE model
J. Gu, Y. Li, et al.
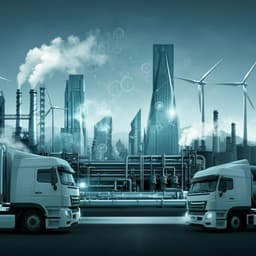
Engineering and Technology
Breaking the hard-to-abate bottleneck in China's path to carbon neutrality with clean hydrogen
X. Yang, C. P. Nielsen, et al.

Environmental Studies and Forestry
Risk to rely on soil carbon sequestration to offset global ruminant emissions
Y. Wang, I. J. M. D. Boer, et al.


