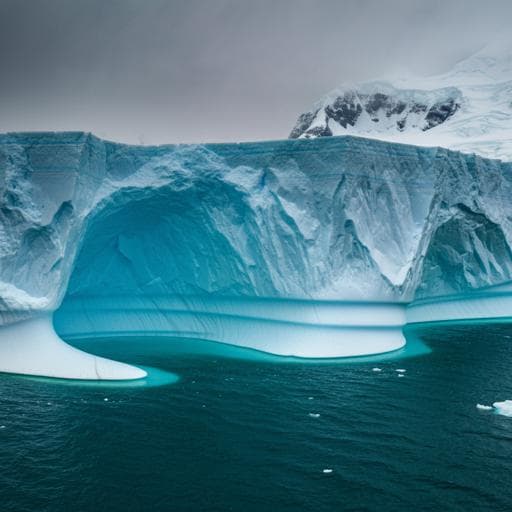
Record-high Antarctic Peninsula temperatures and surface melt in February 2022: a compound event with an intense atmospheric river
I. V. Gorodetskaya, C. Durán-alarcón, et al.
Explore these studies to deepen your understanding
Adjacent work that informs or extends this paper's methodology and findings.

Central tropical Pacific convection drives extreme high temperatures and surface melt on the Larsen C Ice Shelf, Antarctic Peninsula
K. R. Clem, D. Bozkurt, et al.

Record high Pacific Arctic seawater temperatures and delayed sea ice advance in response to episodic atmospheric blocking
T. Kodaira, T. Waseda, et al.

The 2022 Massive Open Online Course (MOOC) to train physiotherapists in the management of people with spinal cord injuries: a qualitative and quantitative analysis of learners’ experiences and its impact
J. V. Glinsky, J. Ilha, et al.
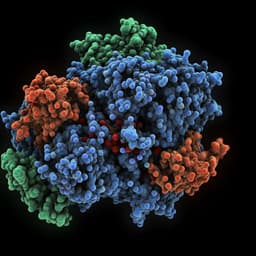
A small molecule compound with an indole moiety inhibits the main protease of SARS-CoV-2 and blocks virus replication
S. Hattori, N. Higashi-kuwata, et al.


