Engineering and TechnologyScientific Reports
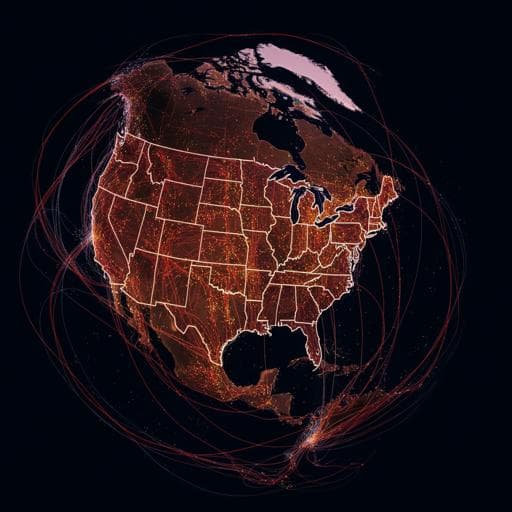
Quantifying human mobility behaviour changes during the COVID-19 outbreak in the United States
Y. Pan, A. Darzi, et al.
This research conducted by Yixuan Pan, Aref Darzi, Aliakbar Kabiri, Guangchen Zhao, Weiyu Luo, Chenfeng Xiong, and Lei Zhang explores the significant shifts in human mobility patterns across the US during the COVID-19 crisis. Utilizing a groundbreaking Social Distancing Index, it reveals how government mandates and local outbreak severity influenced social distancing behavior.
Related Publications
Explore these studies to deepen your understanding
Adjacent work that informs or extends this paper's methodology and findings.

Social Work
Quantifying population contact patterns in the United States during the COVID-19 pandemic
D. M. Feehan and A. S. Mahmud
Economics
Changes in mobility and socioeconomic conditions during the COVID-19 outbreak
M. Dueñas, M. Campi, et al.

Psychology
Emotional adaptation during a crisis: decline in anxiety and depression after the initial weeks of COVID-19 in the United States
A. Shuster, M. O'brien, et al.

Psychology
Associations between dimensions of behaviour, personality traits, and mental-health during the COVID-19 pandemic in the United Kingdom
A. Hampshire, P. J. Hellyer, et al.


