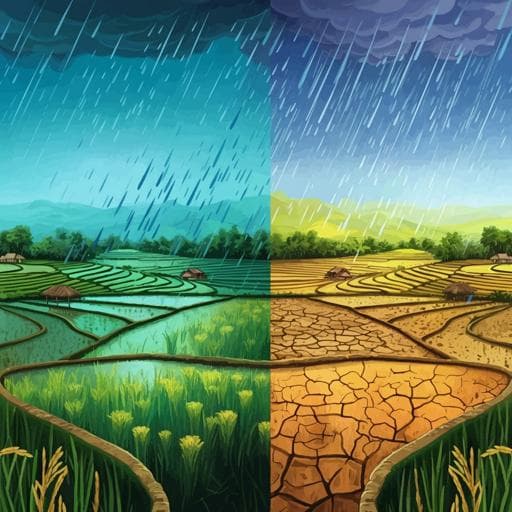
Optimal rainfall threshold for monsoon rice production in India varies across space and time
A. Maiti, M. K. Hasan, et al.
Explore these studies to deepen your understanding
Adjacent work that informs or extends this paper's methodology and findings.
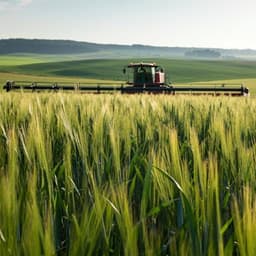
Time management governs climate resilience and productivity in the coupled rice-wheat cropping systems of eastern India
A. J. Mcdonald, Balwinder-singh, et al.

Development of prediction models for screening depression and anxiety using smartphone and wearable-based digital phenotyping: protocol for the Smartphone and Wearable Assessment for Real-Time Screening of Depression and Anxiety (SWARTS-DA) observational study in Korea
Y. Shin, A. Y. Kim, et al.

Selective Attention and Decision-Making Have Separable Neural Bases in Space and Time
D. Moerel, A. N. Rich, et al.

A Prompt Decarbonization Pathway for Shipping: Green Hydrogen, Ammonia, and Methanol Production and Utilization in Marine Engines
J. Shi, Y. Zhu, et al.


