BiologyScientific Reports
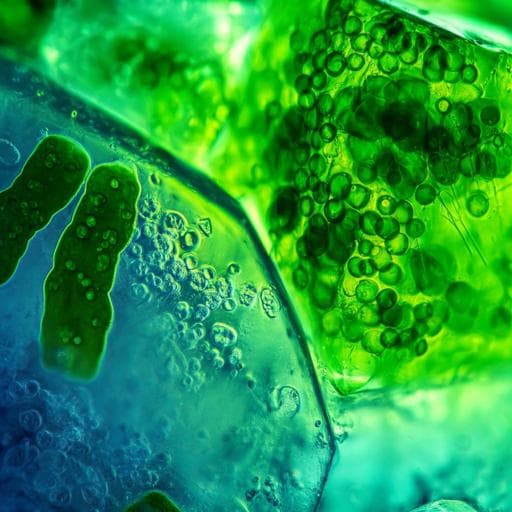
Mapping the *in situ* microspatial distribution of ice algal biomass through hyperspectral imaging of sea-ice cores
E. Cimoli, V. Lucieer, et al.
Discover how ice-associated microalgae contribute to primary production in polar regions! This innovative study, conducted by Emiliano Cimoli and colleagues, utilizes hyperspectral imaging for high-resolution mapping of phototrophic biomass in sea-ice cores, revealing astonishing insights into under-ice biophysical systems.
Related Publications
Explore these studies to deepen your understanding
Adjacent work that informs or extends this paper's methodology and findings.

Earth Sciences
Important role of stratosphere-troposphere coupling in the Arctic mid-to-upper tropospheric warming in response to sea-ice loss
M. Xu, W. Tian, et al.
Earth Sciences
A 1500-year record of mercury isotopes in seal feces documents sea ice changes in the Antarctic
H. Liu, W. Zheng, et al.
Earth Sciences
Rise and fall of sea ice production in the Arctic Ocean's ice factories
S. B. Cornish, H. L. Johnson, et al.

The Arts
Seeing disasters through the eyes of children: a critical reading of One Snowy Night and The Storm in the Barn through the lens of critical disaster studies
H. M. Bayoumy


