Food Science and TechnologyNature Communications
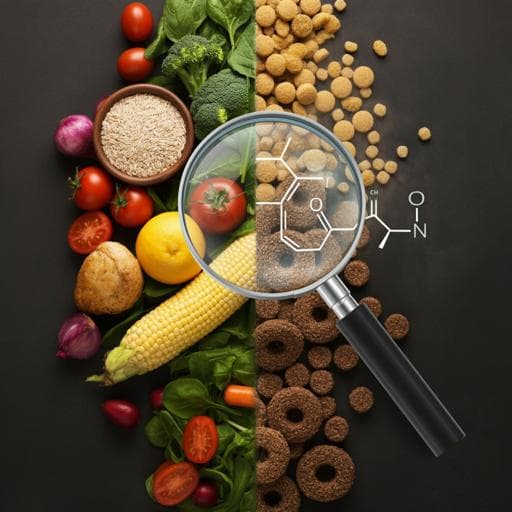
Machine learning prediction of the degree of food processing
G. Menichetti, B. Ravandi, et al.
Discover how FoodProX, a groundbreaking machine learning algorithm developed by Giulia Menichetti, Babak Ravandi, Dariush Mozaffarian, and Albert-László Barabási, reveals that over 73% of the US food supply is ultra-processed. This research highlights alarming connections between ultra-processed food consumption and serious health risks, emphasizing the urgent need for accessible information on food processing to enhance population health.
Related Publications
Explore these studies to deepen your understanding
Adjacent work that informs or extends this paper's methodology and findings.

Medicine and Health
Machine learning-based prediction of in-hospital death for patients with takotsubo syndrome: The InterTAK-ML model
O. D. Filippo, V. L. Cammann, et al.

Earth Sciences
Machine learning prediction of the Madden-Julian oscillation
R. Silini, M. Barreiro, et al.

Chemistry
Accelerating the prediction of CO2 capture at low partial pressures in metal-organic frameworks using new machine learning descriptors
I. B. Orhan, T. C. Le, et al.

Chemistry
Testing the predictive power of reverse screening to infer drug targets, with the help of machine learning
A. Daina and V. Zoete


