Environmental Studies and Forestry
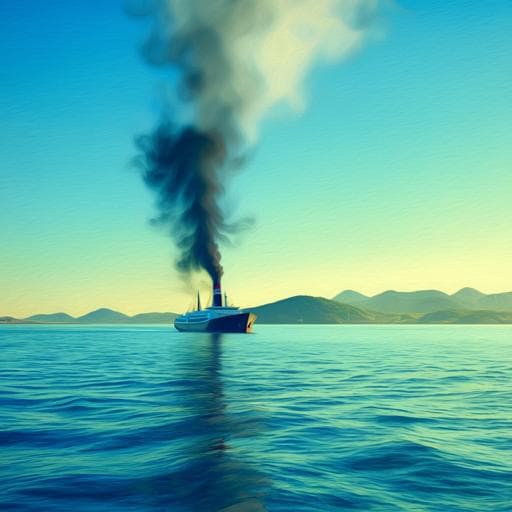
International maritime regulation decreases sulfur dioxide but increases nitrogen oxide emissions in the North and Baltic Sea
W. V. Roy, B. V. Roozendael, et al.
This groundbreaking study explores the effects of European Emission Control Areas (ECAs) and maritime regulations on air quality in the North and Baltic Seas, revealing critical compliance disparities and a concerning rise in NOx emissions. Conducted by a team from the Royal Belgian Institute of Natural Sciences and other prestigious institutions, the findings highlight the pressing need for improved emission regulations to safeguard our environment.
~3 min • Beginner • English
Introduction
Anthropogenic air pollution, including emissions from ocean‑going vessels (OGVs), is a leading global health risk, with substantial contributions from PM2.5 formed secondarily from SO2, NOx and VOCs. MARPOL Annex VI established global limits and Emission Control Areas (ECAs) to reduce ship SO2 and NOx, with the European Sulfur ECAs (SECAs) since 2015 and Nitrogen ECAs (NECAs) since 2021. Previous assessments and modeling suggest health benefits from tighter fuel sulfur limits and Tier III NOx standards, but real‑world effectiveness of these regulations across the wider North and Baltic Sea ECAs remains uncertain. This study asks how European ECAs and related international rules have affected SO2 and NOx emissions region‑wide, assessing compliance behavior, enforcement outcomes, and ambient pollutant levels to determine regulatory effectiveness and remaining gaps.
Literature Review
Prior work quantified significant contributions of shipping to global SO2 and NOx emissions and associated health burdens, with modeling predicting large benefits from stricter fuel sulfur limits and Tier III NOx standards (e.g., Sofiev et al.; IMO GHG studies; Zhang et al.). Reports indicated SO2 reductions after SECA implementation while NOx showed limited initial decline. Studies highlighted that NOx benefits depend on fleet turnover to Tier III and retrofit/overhaul rates, and recommended expanding NECAs. National analyses (e.g., Belgium) showed mixed air‑quality improvements. Emission inventory models (e.g., STEAM) widely used for policy assessments may misrepresent real‑world NOx factors if tier‑specific behaviors are not captured. The SCIPPER project and other efforts also indicated high NOx from Tier II and even some Tier III vessels and advocated enhanced monitoring and enforcement.
Methodology
The study applied a three‑step, multi‑source approach over the North and Baltic Sea ECAs: 1) Remote monitoring of ship plumes: compiled 115,274 OGV measurements from five fixed sniffer sites and nine airborne deployments (2015–2022) operated by multiple Bonn Agreement (BA) Contracting Parties. Platforms included fixed stations (e.g., Hamburg, Kiel, Bremerhaven; Rotterdam) and airborne assets (fixed‑wing aircraft, RPAS, helicopters) measuring SO2 and NOx proxies in exhaust plumes. Non‑compliance was assessed using FSC cutoffs of 0.20%, 0.15% and 0.13% to harmonize across setups where raw datasets were not available for cross‑calibration. Temporal analyses required ≥100 ships/year; spatial analyses required ≥2 years and ≥200 ships, with certain datasets merged or omitted per criteria. Spatial patterns were modeled by S‑curve fits of non‑compliance versus distance to SECA border and distance to port using weighted averages and least squares to derive rate and midpoint parameters. Differences between Baltic and North Sea ECAs were tested (Pearson chi‑square; significance P<0.05). 2) Port inspection and enforcement data: collated BA CPs’ inspection outcomes and penalties (2015–2022) under the EU Sulphur Directive and Implementing Decision, and EU‑wide inspection data from Thetis‑EU, including documentary checks and fuel sample analyses inside and outside SECAs. NOx inspection/penalty data were requested, but most BA CPs do not yet enforce NOx; only limited data were available. 3) Satellite spatiotemporal analysis (2018–2022): used TROPOMI Sentinel‑5P SO2 and NO2 vertical column density (VCD) products (SO2 COBRA V01; NO2 PAL v2.3.1). Pixels with QA≥0.75 were averaged to monthly means. Spatial comparisons considered North Sea sub‑regions (Northern NECA, BA Quadripartite Zone of Joint Responsibility—BAQPZJR, English Channel) and the Bay of Biscay (outside ECA). Temporal SO2 analysis compared annual and monthly periods before (2018–2019) vs after (2021–2022) the 2020 global sulfur cap, omitting 2020 for SO2 due to COVID‑19 confounding; temporal NO2 analysis computed proportional differences annually (2019 vs 2022) and as average monthly proportional change before NECA (May 2018–Dec 2020) vs after NECA (Jan 2021–Dec 2022). The study also documented methodological uncertainties, sensor bias correction efforts (e.g., Belgian plume simulation mixtures), and the influence of seasonality and land‑based sources on satellite NO2.
Key Findings
- SO2 fuel sulfur compliance: Across the European SECAs, FSC non‑compliance (0.15% cutoff) decreased from 7.1% to 0.7%, averaging 1.5% over the period; after the 2020 global sulfur cap, non‑compliance averaged 0.6%, with slight increases noted in 2022 amid higher fuel prices.
- Platform/location differences: Fixed stations near ports showed lower non‑compliance (∼1.0%) versus airborne measurements at sea (∼5.3%); French RPAS yielded the highest average non‑compliance (9.4%) among remote operations. Differences were statistically significant (P<0.001) across cutoffs.
- Spatial gradients: Non‑compliance was highest near the SECA border (~30% at the border in dedicated measurements) and decreased exponentially with distance; highest risk was within 300–450 km of the border; at >900 km at sea, non‑compliance was ~1.4% (0.15% cutoff). Non‑compliance increased starting ~70–90 km from ports; port influence waned beyond ~180 km.
- Regional contrast: Baltic Sea exhibited higher SO2 non‑compliance than North Sea (2.2% vs 1.3% at 0.15% cutoff; P<0.001). North Sea non‑compliant ships tended to have higher absolute FSC exceedances, whereas Baltic had more low‑level exceedances.
- BA inspections and penalties (2015–2022): 996 sulfur infringements were observed, 544 penalized. Before 2020: 885 infringements (mean 21.6/year per BA CP), 442 penalties (10.8/year; 56% of infringements). 2020–2022: 111 infringements (mean 4.8/year per BA CP; P<0.001), 102 penalties (91%; mean 4.3/year; P<0.05), indicating strong legal follow‑up post‑cap.
- EU‑wide inspections (Thetis‑EU): 110,657 documentary inspections conducted in the wider SECA. Non‑compliance rates: North Sea 7% vs Baltic Sea 3% (P<0.001); within SECA 5% vs outside 2% (P<0.001). Fuel sample non‑compliance: North Sea 5% vs Baltic Sea 2% (P<0.001); both showed sharp declines by 2020 with slight North Sea uptick in 2022.
- Satellite SO2 VCD: After the 2020 global sulfur cap, SO2 decreased notably in BAQPZJR (−22.5%), Northern SECA (−15.9%), and English Channel (−9.5%); Bay of Biscay showed a small increase (+3.0%), likely due to lower baseline and sensitivity limits.
- NOx emissions and compliance: Belgian airborne data indicate increasing average NOx emission factors and rising NOx non‑compliance; Tier II vessels exhibit higher NOx than Tier I, and the growing share of Tier II coincides with higher averages. Danish modeling reassessment aligns with these findings.
- NOx enforcement: Only two BA CPs reported NOx infringements, and just one imposed a penalty, indicating minimal enforcement; available data suggest no reduction in NOx violations post‑NECA.
- Satellite NO2 VCD: Annual proportional change (2019–2022) showed increases in Bay of Biscay (+14.4%), English Channel (+4.1%), and Northern NECA (+1.0%), with a decrease in BAQPZJR (−5.8%). Monthly proportional analysis found Bay of Biscay +10.3%, English Channel +4.0%, Northern NECA −1.4%, BAQPZJR −5.0%, with strong land‑area decreases during COVID‑19 influencing regional patterns.
Discussion
The multi‑stream evidence indicates that sulfur regulations and their enforcement in European SECAs have been effective: remote monitoring, port inspections, and satellite observations converge on decreasing SO2 non‑compliance and ambient SO2, especially after the 2020 global sulfur cap. Nevertheless, non‑compliance remains higher at sea and near SECA borders than in ports, pointing to adaptive behavior and the need for continued remote monitoring and targeted enforcement offshore. In contrast, NOx controls under the NECA have not yet delivered measurable emission or ambient concentration reductions at sea. This is consistent with limited penetration of Tier III engines, higher real‑world NOx factors for Tier II vs Tier I, and weak NOx enforcement frameworks. Satellite NO2 trends show reductions over land (reflecting broader emission controls and COVID‑19 effects) but stable or rising levels over many maritime areas, reinforcing conclusions from in‑situ data. The results imply that to achieve public‑health and environmental benefits anticipated in prior studies, regulatory design must address fleet turnover, technology performance across load conditions, inspection and sanction mechanisms, and spatial compliance variability. Emission and air‑quality models should be updated with tier‑specific real‑world NOx factors and observed compliance patterns to improve health impact assessments and policy planning.
Conclusion
International maritime sulfur regulations, supported by robust EU/BA inspection regimes and remote monitoring, substantially reduced SO2 non‑compliance and ambient SO2 in the North and Baltic Sea SECAs, particularly after the 2020 global sulfur cap. However, current NOx regulations have not reduced NOx emissions or ambient NO2 at sea; in several areas NO2 increased. The study recommends: strengthening and revising NOx standards and enforcement (including effective port and at‑sea inspection/sanction frameworks), accelerating Tier III uptake and ensuring real‑world performance, and expanding NECAs (e.g., Mediterranean and North Atlantic) alongside enhanced requirements to achieve actual air‑quality improvements. Models and inventories should incorporate real‑world, tier‑specific NOx factors and spatially resolved compliance to better represent shipping impacts. Future work should include intercomparison and bias‑correction of remote sensors, granular spatial analysis using raw plume data, and integrated assessments that separate land‑based influences from maritime signals.
Limitations
- Remote datasets from different platforms have methodological differences and potential biases; raw data from several parties were unavailable, limiting cross‑calibration and direct comparison of average FSC levels.
- Spatial fitting (e.g., distance to port) used relatively few points in some cases; results should be interpreted cautiously pending dedicated analyses on raw data.
- Satellite SO2 sensitivity is limited over low‑pollution regions; 2018 and 2022 had missing months, and 2020 (COVID‑19) was excluded from the primary SO2 temporal comparison.
- Satellite NO2 analyses are influenced by seasonality, meteorology, background chemistry, and substantial land‑based source trends (e.g., COVID‑19 lockdown effects), complicating attribution solely to shipping.
- Baltic Sea satellite assessment was incomplete due to limited winter coverage and strong land influences.
- NOx enforcement data are sparse: most BA CPs do not enforce or report NOx, preventing robust compliance statistics.
- Differences between airborne and fixed station targeting (risk‑based vs non‑selective) may bias apparent non‑compliance rates.
Related Publications
Explore these studies to deepen your understanding of the subject.

