logo
ResearchBunny Logo
Determination of the Dzyaloshinskii-Moriya interaction using pattern recognition and machine learning

Physics

Determination of the Dzyaloshinskii-Moriya interaction using pattern recognition and machine learning

M. Kawaguchi, K. Tanabe, et al.

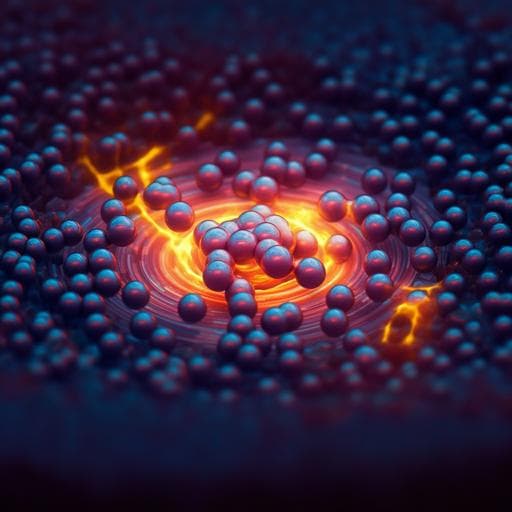
This groundbreaking research by Masashi Kawaguchi and team showcases the innovative use of machine learning to extract crucial material parameters from a single magnetic domain image. Their convolutional neural network effectively estimates the Dzyaloshinskii-Moriya interaction and magnetic anisotropy, paving the way for advancements in magnetic memory technologies.

00:00
00:00
~3 min • Beginner • English
Introduction
The Dzyaloshinskii-Moriya (DM) interaction is an antisymmetric exchange that stabilizes chiral magnetic textures such as spin spirals, chiral Néel domain walls, and skyrmions. Its interfacial form in ultrathin ferromagnet/heavy-metal heterostructures is key for next-generation magnetic memory concepts leveraging current-driven motion via spin Hall effects. Accurate determination of the DM exchange constant (D) is challenging with conventional dynamic methods (domain-wall motion, spin-wave propagation, switching) due to model dependencies and pinning effects arising from spatial distributions of magnetic anisotropy. Since equilibrium magnetic domain patterns reflect the balance of exchange, anisotropy, dipolar, and DM energies, they inherently encode information about D. However, direct nanoscale imaging of skyrmion size or domain-wall chirality typically requires advanced instruments. This study proposes and demonstrates that pattern recognition with machine learning can extract D (and anisotropy distribution) directly from a single micrometer-scale magnetic domain image, thereby simplifying parameter determination and mitigating dynamic pinning artifacts.
Literature Review
Prior approaches to quantify interfacial DM interaction include: (i) current- or field-driven domain-wall motion analyses that infer D from asymmetric velocities or effective fields; (ii) spin-wave spectroscopy detecting nonreciprocal dispersion; (iii) fitting current/field-dependent magnetization reversal characteristics. These methods can suffer from uncertainties due to pinning, sample inhomogeneity, and reliance on specific dynamical models. Skyrmion size scaling and wall structure mapping can also determine D but demand high spatial resolution imaging (tens of nanometers). The literature establishes that interfacial D arises at ferromagnet/heavy-metal interfaces with strong spin–orbit coupling, and its magnitude can stabilize chiral Néel walls and room-temperature skyrmions. Nevertheless, the intertwined influence of magnetic anisotropy distribution on dynamics complicates D extraction, motivating a static-image-based, data-driven alternative.
Methodology
Overall approach: Use micromagnetic simulations to generate large datasets of synthetic magnetic domain images with known material parameters, train a convolutional neural network (CNN) to regress the DM exchange constant D and the standard deviation σ describing spatial distribution of anisotropy, then apply the trained model to experimental domain images from Co-based heterostructures. Micromagnetic simulations: GPU-based code solves the Landau–Lifshitz–Gilbert equation with thermal noise. Effective field derives from exchange, uniaxial anisotropy, interfacial DM interaction, and demagnetizing energies. Cells: 4 × 4 × t nm^3 (t = ferromagnetic thickness), grid 512 × 512 (2.048 × 2.048 μm^2), periodic boundary conditions. Images are downsampled to 128 × 128 pixels (16 × 16 nm^2 pixels). Anisotropy distribution: 8 × 8-cell blocks assigned local Ku values drawn from a normal distribution with mean Ku and standard deviation σ. Initial magnetization is randomized; energy minimization yields equilibrium at T = 0 K (for training/validation in Fig. 2) or T = 300 K (for experimental comparison in Fig. 4). D and σ are systematically varied to create labeled datasets. For Fig. 2: 110,000 simulations, with 100,000 for training and 10,000 for testing. For Fig. 4: 27,500 base simulations; data augmentation by rotations (90°, 180°, 270°) yields 110,000 images. Machine learning model: A 12-layer CNN: 10 convolutional layers (3 × 3 filters; strides: first six 1 × 1, last four 2 × 2) with filter counts [64, 64, 40, 36, 32, 28, 24, 20, 16, 16], followed by two fully connected layers (first FC has 10 units). ReLU activations after all conv layers and the first FC. Huber loss for regression; Adam optimizer. Implemented in Sony Neural Network Console. Batch size 64, trained for 100 epochs. For a given dataset, four independently trained models (“machines”) are produced; their outputs are averaged and standard deviations computed. Testing set size is 1/10 of training. For experimental estimation, each image is augmented by rotations to produce four inputs fed to the four machines (16 predictions total); the mean is reported, and 95% confidence intervals are computed from the mean and variance of the 16 values. A simple residual network was also tested (performance in Supplementary). Experimental samples and measurements: Sputtered films: Si substrate/Ta(d)/Pt(2.6 nm)/Co(0.9 nm)/MgO(2 nm)/Ta(1 nm). A moving shutter creates a Ta seed layer thickness gradient d ≈ 0–3 nm over 10 mm. Ms measured by VSM (average ≈ 1445 kA m^-1). Hall bars (≈60 μm × 10 μm) are fabricated; anisotropy field Hk obtained from in-plane field Hall measurements; effective perpendicular anisotropy Keff = Ku − Ms^2/(2 μ0). D is independently extracted by analyzing switching field Hc versus in-plane field Hx: sharp reduction at Hx ≈ HDM, with HDM = D/(μ0 Ms Δ), Δ = Aex/Keff; fitting yields HDM and hence D. Domain images are obtained with a magnetic microscope using an MTJ sensor with sub-micrometer resolution; images are analyzed by the trained CNN. For training aimed at experimental comparison, Ms and Keff are set from experiments (using lower and upper bounds Keff ≈ 0.24 and 0.37 MJ m^-3 across d), and Aex is taken from literature on Co. Thermal fluctuations are included via Langevin fields at 300 K.
Key Findings
- The CNN accurately regresses the DM exchange constant D from simulated domain images: Dset spanning 0–0.9 mJ m^-2 is recovered with close D_est vs D_set agreement; histograms show tight distributions for representative Dset values (0.2, 0.4, 0.6, 0.8, 1.0 mJ m^-2). - When both D and σ (standard deviation of local anisotropy) are varied during training, the model independently estimates both parameters from a single image. The σ estimates show high accuracy with rms error ≈ 0.005. - Applying the trained model to experimental images from Ta(d)/Pt/Co/MgO heterostructures yields D values whose dependence on Ta seed layer thickness d agrees with independent transport-based extractions (via Hc(Hx) analysis). D increases sharply when d exceeds ~1 nm, consistent with improved Pt/Co interfacial texture and prior reports. - The estimated σ from experimental images decreases monotonically with increasing d, tracking trends in Keff, and showing behavior distinct from D, indicating the model’s capability to disentangle non-correlated parameters. - Overall estimation accuracies are approximately 0.05 mJ m^-2 for D and 0.005 for σ, with 95% confidence intervals computed from augmented predictions.
Discussion
The study demonstrates that equilibrium magnetic domain patterns contain sufficient information to infer key material parameters, specifically the DM exchange constant and anisotropy disorder, using supervised learning. By training on large ensembles of micromagnetically generated images that capture variability in anisotropy landscapes and initial states, the CNN learns robust, discriminative features of domain morphology linked to D and σ. The successful recovery of D from experimental images and its agreement with independent transport-based determinations validate the approach and indicate that the trained model generalizes beyond simulation. The distinct d-dependence of D (abrupt rise above ~1 nm Ta) and σ (monotonic decrease) further supports the method’s ability to independently resolve multiple, non-correlated parameters. This image-based inference bypasses dynamic pinning complications and reduces reliance on specialized high-resolution imaging, providing a rapid, single-image pathway to parameter extraction. The framework can, in principle, be extended to jointly estimate other micromagnetic parameters (Ms, Keff, Aex) provided parameter correlations are manageable and training data sufficiently span the relevant spaces.
Conclusion
Pattern recognition with a CNN trained on micromagnetic simulations enables extraction of the interfacial DM exchange constant D and the anisotropy distribution parameter σ from a single magnetic domain image. The approach achieves accuracies of ~0.05 mJ m^-2 (D) and ~0.005 (σ), reproduces experimentally measured D trends versus Ta seed-layer thickness, and reveals a monotonic reduction of σ with increasing d. This strategy simplifies experimental workflows for characterizing chiral magnetic systems and can be generalized to simultaneous estimation of additional material parameters (e.g., Ms, Keff, Aex). Future work may improve accuracy via enhanced architectures, broader training datasets with realistic disorder and temperature effects, and systematic treatment of parameter correlations to enable comprehensive, multi-parameter inference.
Limitations
- Parameter identifiability depends on low correlation among target parameters; strong correlations could degrade independent estimation. - Training relies on micromagnetic models and assumed parameter ranges (e.g., Aex from literature); model mismatch or unaccounted physics could bias estimates. - Image size and resolution constraints: training images are ~2 × 2 μm^2 and downsampled to 128 × 128; experimental imaging must have spatial resolution significantly better than ~1 μm, limiting use of conventional Kerr microscopy. - The approach assumes known or bounded values for some parameters (e.g., Ms, Keff) when generating training sets for experimental inference. - Domain morphology can be influenced by factors beyond D and σ (e.g., defects, roughness, multi-grain textures); incomplete representation in training data may affect generalization.
Listen, Learn & Level Up
Over 10,000 hours of research content in 25+ fields, available in 12+ languages.
No more digging through PDFs, just hit play and absorb the world's latest research in your language, on your time.
listen to research audio papers with researchbunny