
Chemistry
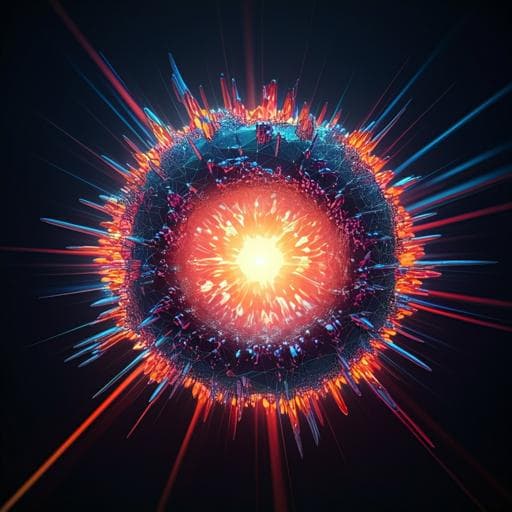
Concurrent oxygen evolution reaction pathways revealed by high-speed compressive Raman imaging
R. Pandya, F. Dorchies, et al.
This cutting-edge research, conducted by Raj Pandya and colleagues, employs high-speed compressive Raman imaging to delve into the intricate mechanisms of the oxygen evolution reaction in α-Li₂IrO₃. The findings reveal fascinating bias-dependent pathways for the reaction—insights that could transform our understanding of charge compensation in crystalline catalysts.
~3 min • Beginner • English
Introduction
The oxygen evolution reaction (OER) is the anodic half-reaction essential for water and CO2 electrolysis but is kinetically sluggish due to the four-electron/four-proton process. Catalyst structure strongly influences OER mechanisms. In amorphous, electrolyte-permeable catalysts, all metal sites can be redox active and exchange ions with the electrolyte, enabling bulk charge storage during OER. In contrast, dense, non-porous crystalline catalysts typically exhibit redox changes only at outermost surface sites, complicating operando study because only a small fraction of material changes during OER. Emerging evidence suggests that some crystalline layered oxides (e.g., α-Li2IrO3 and LiCoO2) can undergo surface reactions with water that induce bulk cation exchange, potentially involving bulk redox sites in OER. However, the extent, dynamics, and potential dependence of such charge-compensation pathways in these dense crystalline catalysts remain unclear, particularly regarding how intercalating cations propagate relative to O2 evolution rates. In-situ, chemically specific, high spatiotemporal resolution measurements are required because ex-situ methods cannot capture transient active states that relax in electrolyte.
Literature Review
Prior operando studies on amorphous and electrolyte-penetrable OER catalysts (e.g., Co-Pi, transition metal (oxy)hydroxides, some Ir-based systems) have shown bulk redox activity and ion exchange throughout films, with charge accumulation scaling with potential/current. For classical dense crystalline catalysts, redox is confined to surface sites. Recent ex-situ and operando indications for layered crystalline oxides (α-Li2IrO3, LiCoO2) suggest cation insertion/exchange can accompany OER and might extend charge compensation into the bulk, but rates, spatial extent, and potential dependence remained unresolved. Raman spectroscopy (spontaneous, SERS/SHINERS, time-gated) has been widely applied to track OER intermediates and electrode dynamics with bond selectivity, but low signals limit real-time chemical imaging with high spatial and temporal resolution, especially in the 300–1200 cm−1 region crucial for many electrochemical systems. Compressive Raman imaging has reduced data loads and improved sensitivity but had been applied mainly to static samples; its operando use for dynamic electrochemical processes was unexplored prior to this work.
Methodology
- Catalyst preparation: α-Li2IrO3 synthesized by solid-state grinding of IrO2 and Li2CO3 (5% excess), following literature. LiCoO2 and IrO2 commercial. Catalyst inks (5 mg powder in THF, plus Nafion D-520) were drop-cast onto conductive coverslips (ITO or ~10 nm Ti). Agglomerate particles (2–5 µm) composed of primary crystalline particles (hundreds of nm to ~1 µm) were formed.
- Electrochemical setup: Three-electrode cell with ITO or Ti-coated coverslip as working electrode, Pt wire counter, Ag/AgCl reference (calibrated vs RHE). Electrolytes: 1.0 M KOH or 1.0 M LiOH (pH ~14), room temperature. CV scan rates for Raman experiments: 10 mV/s (spectrally resolved) and 4 mV/s (imaging). Potential not iR-corrected.
- Raman instrumentation: Epi-detected spontaneous Raman microscope, 532 nm excitation (1.4 NA oil-immersion objective), laser penetration depth ~900 ± 200 nm in α-Li2IrO3. Conventional spectrometer with EMCCD for full spectra; programmable compressive spectrometer with DMD and single-photon avalanche photodiode (SPAD) for high-speed imaging. Optimal binary spectral filters selected species-specific Raman bands (notably ~550 and ~640 cm−1) with orthogonality to accommodate peak shifts. Imaging speeds up to ~0.3 fps over ~50 µm2 with per-pixel integration 20–50 µs; maximum pump power 30 mW to avoid damage.
- Operando imaging protocol: Particles were imaged through the backside of the substrate while stepping/ramping potentials. Integrated intensity maps of the ~640 cm−1 band (and ~550 cm−1) were acquired across cycles to visualize spatial phase fronts corresponding to cation (de)intercalation (Li+, K+). Line-cut analysis across particle boundaries extracted sigmoidal fronts and their temporal evolution to estimate phase-front velocities.
- Bubble imaging: Bright-field optical microscopy (0.4 NA, 60×) through electrolyte to track O2 bubble nucleation and growth at 10 fps during potential ramps (5 mV/s) after initial cycles. Quantified O2 generation rates per agglomerate from bubble dynamics.
- DFT calculations: CRYSTAL17 with PBE0 functional and localized Gaussian basis sets to compute vibrational modes for α-Li2IrO3, delithiated α-Li0IrO3, and K-intercalated hydrated α-Li1K0.25IrO3·0.5H2O (close to experimentally observed compositions). DFT used to assign in-plane (~550 cm−1) and out-of-plane (~640 cm−1) Ir–O vibrational modes and predict relative frequency shifts upon (de)intercalation.
- Additional controls: Cycling in LiOH and on IrO2 to test for bulk cation exchange signatures; replicated across >40 agglomerates; SEM for morphology; optical coherence tomography for particle thickness estimation; multiple repeats and scan-rate variations (down to 0.4 mV/s) to assess robustness.
- Potentiostatic holds: After two activation cycles, potentials were ramped then held for 2 min at 1.4–1.7 V vs RHE, followed by 8 min open-circuit relaxation, while performing Raman imaging to test potential-dependent charge-compensation pathways.
Key Findings
- Raman mode assignments and spectral evolution:
• α-Li2IrO3 exhibits peaks near ~550 cm−1 (in-plane Ir–O stretch/scissor) and ~640 cm−1 (out-of-plane Ir–O stretch). Upon initial anodic activation (delithiation to ~α-Li1IrO3), the ~640 cm−1 mode intensity decreases by ~50% and the ~550 cm−1 mode by ~10%, with both modes red-shifting (high-resolution Raman). Upon K+ intercalation during cycling in KOH, the ~640 cm−1 mode partially recovers (to ~40% of pristine intensity) and blue-shifts by ~15 cm−1; the ~550 cm−1 mode remains relatively unchanged in position/intensity compared to activated state.
- Operando CV-linked Raman intensity changes (KOH):
• During initial anodic scan (1.1→1.7 V vs RHE), ~640 cm−1 decreases by ~40% and ~550 cm−1 by ~5% (consistent with delithiation). On the cathodic scan, ~640 cm−1 increases but remains below pristine, indicating K+ intercalation. In subsequent cycles, reversible ~40% modulation of ~640 cm−1 and small (~5–10%) changes of ~550 cm−1 persist, with onset near ~1.34 V vs RHE for changes after cycle 1, evidencing regeneration of the active α-Li2IrO3 phase.
- Spatially resolved Raman imaging:
• First anodic scan: ‘Shrinking-core’ pattern with diminishing ~640 cm−1 intensity propagating from particle surface inward (Li+ deintercalation). Cathodic scan: intensity increases from edges, consistent with K+ intercalation.
• Subsequent anodic scans: Core intensity decreases before the shell, yielding a core–shell distribution; during cathodic scans, gradual homogeneous replenishment occurs. Similar behaviors observed in LiCoO2. In LiOH, beyond initial delithiation, no substantial Raman intensity changes; IrO2 shows no significant band modulation in the 1.1–1.7 V range.
- O2 evolution metrics (bubble imaging):
• O2 generation rates per agglomerate increase up to ~2×10^9 molecules s−1 as potential ramps to ~1.5 V vs RHE, then slow at higher potentials (likely geometric/bubble-size effects). By 1.7 V vs RHE, 0.5–1.5×10^9 molecules are produced per agglomerate during the anodic scan. Bubble nucleation occurs more often at agglomerate edges (~75%).
- Phase-front kinetics and interface widths:
• Phase-front ‘velocity’ (normalized by voltage): 82 ± 20 nm s−1 V−1 for initial Li deintercalation; 120 ± 20 nm s−1 V−1 for K+ (de)intercalation across subsequent cycles (also consistent with first cathodic K+ intercalation). After potential release following potentiostatic holds, K+ intercalation front velocity ≈25 ± 7 nm s−1 (non-normalized), similar to ~30 ± 5 nm s−1 during CVs.
• Phase-boundary width: Initially sharp (~400 nm) for Li deintercalation (indicative of biphasic behavior), broadening to as much as ~1.8 µm during K deintercalation (solid-solution-like behavior).
- Potential-dependent charge-compensation pathways:
• High overpotentials (e.g., holds at 1.6–1.7 V vs RHE): Potassium-rich shell forms transiently but disappears during the 2 min hold, leaving fully oxidized particles; OER proceeds on periphery with charge compensation limited to surface redox sites, as K+ diffusion into bulk is too slow relative to O2 evolution rate.
• Lower overpotentials (1.4–1.5 V vs RHE): Core depletes while shell remains K+-rich even after 2 min holds, reflecting quasi-static equilibrium where chemical intercalation from electrolyte maintains near-surface K+; charge compensation extends into bulk.
- Generality and controls: No bulk intercalation signatures in LiOH (Li+ too large/hydrodynamically hindered) or in crystalline IrO2. Similar cycle-dependent spatial patterns observed in LiCoO2.
Overall, compressive Raman imaging directly visualizes concurrent, bias-dependent OER charge-compensation pathways in dense crystalline catalysts: surface-only at high overpotentials versus bulk-extended via cation exchange at lower overpotentials.
Discussion
The study addresses how charge compensation occurs during OER in dense, layered crystalline catalysts by directly imaging cation (de)intercalation and correlating it with O2 evolution. The operando Raman maps of the ~640 cm−1 mode delineate moving phase fronts within agglomerates, revealing that at low overpotentials, chemical intercalation from the electrolyte sustains bulk charge compensation, while at high overpotentials, rapid O2 evolution outpaces cation transport, confining charge compensation to surface redox sites. The extraction of phase-front velocities and boundary widths clarifies kinetic regimes (biphasic-like Li deintercalation vs solid-solution-like K deintercalation) and supports a competition model between K+ deintercalation (shrinking-core) and simultaneous intercalation from the electrolyte (edge-initiated), resulting in observed core–shell Raman intensity patterns. Controls in LiOH and on IrO2 validate that the observed bulk involvement is specific to systems allowing K+ exchange. These insights reconcile prior ambiguities about bulk versus surface participation in OER in crystalline materials and expand the mechanistic framework beyond purely surface-limited processes.
Conclusion
This work demonstrates, using high-speed compressive Raman imaging coupled with operando electrochemistry and bubble imaging, that dense crystalline layered electrocatalysts such as α-Li2IrO3 (and LiCoO2) exhibit concurrent OER charge-compensation pathways that depend on applied potential/current density. At high overpotentials, charge compensation is limited to surface redox sites due to rapid O2 evolution and slow cation exchange, whereas at lower overpotentials, cation intercalation extends charge compensation into the bulk. Quantitative mapping of vibrational signatures, phase-front velocities, interfacial widths, and O2 evolution rates provides a mechanistic basis for tuning electrocatalyst operation. The approach generalizes to other layered systems and potentially to acidic media where proton insertion may accompany chemical O2 generation. Future research should expand chemically sensitive, time-resolved imaging to higher spatial resolution (near-field/super-resolution), develop models capturing multiparticle and diffusion heterogeneity, and explore electrolyte/cation engineering to optimize bulk versus surface charge-compensation regimes.
Limitations
- Particle heterogeneity: Measurements are on agglomerates comprising multiple primary crystals with complex 3D geometry; disentangling individual particle contributions and exact nucleation centers is limited by micrometer spatial and 0.1 s (bubble) time resolutions.
- Ambiguity in simultaneous fluxes: Cannot separately quantify properties (velocities, hydration states) of K+ ions entering versus leaving during concurrent processes.
- Scan-rate and instrumentation constraints: Raman imaging synchronized with electrochemistry precludes very high scan rates; even electrochemical-only scans are complicated by bubble formation and surface blockage. Potential not iR-corrected, though low ohmic resistance measured.
- Modeling complexity: Simple rate or phase-field models are insufficient given the multiparticle, non-porous yet ion-exchange-capable architecture and dynamic electrolyte interactions.
- Generalizability to other electrolytes/ions: While LiOH and IrO2 controls support conclusions, broader ion/electrolyte chemistries and acidic conditions require dedicated validation.
- Depth resolution: Finite laser penetration (~900 ± 200 nm) integrates signals over a volume, complicating precise separation of surface versus bulk contributions.
Related Publications
Explore these studies to deepen your understanding of the subject.