logo
ResearchBunny Logo
Changes in mobility and socioeconomic conditions during the COVID-19 outbreak

Economics

Changes in mobility and socioeconomic conditions during the COVID-19 outbreak

M. Dueñas, M. Campi, et al.

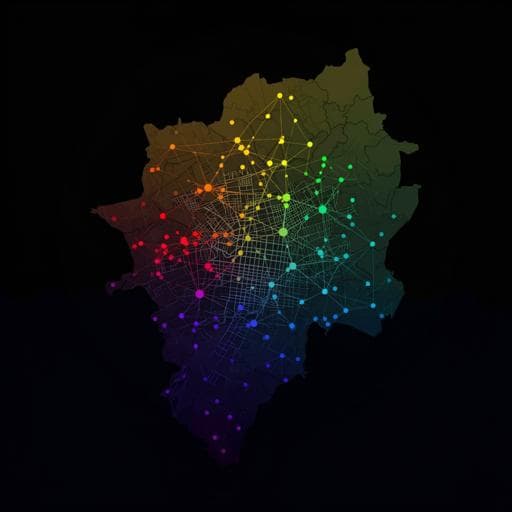
This research by Marco Dueñas, Mercedes Campi, and Luis E. Olmos explores how COVID-19 containment measures altered mobility in Bogotá, revealing that socioeconomic factors significantly influenced responses to lockdown. High-income groups saw greater drops in mobility compared to lower-income populations, highlighting the complexities of urban mobility in times of crisis.

00:00
00:00
~3 min • Beginner • English
Introduction
The study investigates how COVID-19 containment measures affected human mobility in Bogotá and how responses varied with socioeconomic conditions. Governments worldwide restricted mobility to increase social distancing, and aggregate mobility data can inform public health actions. Prior work shows mobility reductions during lockdowns, mostly in high- and some middle-income countries, with evidence that socioeconomic conditions shape compliance. Bogotá, a large, unequal city with high informality and heavy reliance on public transport, provides a pertinent case. The research questions are: (1) How did mobility flows and network connectivity change following lockdown and partial reopening? (2) How are changes in mobility associated with local socioeconomic conditions such as socioeconomic strata (SES), informality, poverty, and vulnerability? The purpose is to characterise mobility network dynamics before/during lockdown and quantify the role of socioeconomic factors in shaping mobility responses.
Literature Review
The paper references studies using large-scale mobile phone and social media data demonstrating significant mobility changes during lockdowns in high-income countries (e.g., USA, Italy, Europe) and evidence from middle-income contexts (China, Brazil). Literature also documents differential responses by socioeconomic status, suggesting inequality both drives and is exacerbated by the pandemic. Broader socioeconomic impacts include increased unemployment, reduced work hours, and uneven distribution of adverse effects. In Colombia and similar middle-income settings, high informality constrains the feasibility of remote work and compliance with mobility restrictions. The paper situates its contribution in providing detailed, city-level evidence from Bogotá linking mobility network changes to socioeconomic heterogeneity, an area less explored empirically.
Methodology
Study area and units: Bogotá comprises 19 urban localities plus one rural locality, subdivided into 117 Zonal Planning Units (UPZ). UPZ are used as the main analysis unit to better capture socioeconomic heterogeneity relevant to urban planning. Socioeconomic measures: Block-level census indicators were aggregated to UPZ with population weights. SES is a 1–6 housing-based stratification reflecting residents’ income-related living conditions (strata 1–3: 86.04% of population; 4: 9.42%; 5–6: 4.54%). Multidimensional poverty follows DANE’s five-dimension, 15-indicator index; households are poor if deprived in ≥33.3% indicators. Vulnerability is built from shares of individuals with COVID-19 risk comorbidities, persons over 60 in overcrowded or single households, and population density (from 2018 census and health records). Informality at the UPZ level is defined as the share of employed individuals with income not enrolled in the health system or pension fund; historical informality rates in Colombia range 60–70%. Mobility data: Public transport smart-card validations from Bogotá’s integrated system: TransMilenio (TM, BRT) and SITP buses. Each validation logs stop/station, date, time, and anonymous card ID, enabling reconstruction of users’ daily movements. A trip is defined between consecutive validations at different stops by the same card. data cleaning excluded cards with a single daily validation, consecutive validations at the same stop, validations at bus garages, and cards with >10 daily validations (likely system workers). All 143 TM stations and geolocated SITP stops were used, totaling 6,197 stops. Temporal aggregation: Weekly networks built using only Tuesday–Thursday working days to avoid weekend/holiday effects. The week of February 3, 2020, serves as the pre-lockdown baseline. Mobility ratios are weekly flows relative to the baseline week. Network construction and metrics: Stop-level directed, weighted graphs per week (nodes = stops; edge weight = count of consecutive validations). Also aggregated to UPZ by grouping stops within UPZ. Node statistics include out-strength (total outflows), in-strength (total inflows), out-degree (number of destinations), and in-degree (number of origins). Network density is computed as m/[n(n−1)]. Time and distance between consecutive validations were analysed to distinguish short-lasting (<6h) vs long-lasting (6–16h) trips. Gravity model: For flows W_od(t) between UPZ o and d in week t, a multiplicative gravity specification with origin/destination populations (Pop_o, Pop_d), distance (D_od), socioeconomic covariates (SES, Informality, Poverty) at origin and destination, and week dummies r_t was estimated via Poisson Pseudo-Maximum Likelihood (PPML) to handle heteroskedasticity and zeros. Due to high collinearity among SES, informality, and poverty, each socioeconomic variable was included in separate models. Models were estimated for all trips and separately for long-lasting and short-lasting trips, both pre- and post-lockdown. National context: Facebook Data for Good Movement Range Maps (Change in Movement metric) at municipality scale were combined with municipal multidimensional poverty to assess mobility-poverty correlations during lockdown and partial reopening across Colombia.
Key Findings
- Sharp mobility reduction after policy implementation: Following school closures (Mar 16, 2020) and strict lockdown (week of Mar 23), mobility flows dropped to 23.3% of baseline in the lockdown week and reached a minimum of 16.8% two weeks later. During partial reopening (from Apr 27), mobility gradually recovered, reaching 35.5% (week of Jun 22) and up to 36.6% (week of Jul 6) of baseline before selected locality lockdowns. - Network connectivity and resilience: Despite volume declines, locality- and UPZ-level networks remained highly connected. Stop-level density fell from 2.06% pre-lockdown to 0.78% in lockdown. UPZ-level density decreased from 90.07% to 81.21%, indicating preserved connectivity across city areas. Many links persisted but stops showed reduced out-degrees during lockdown. - Spatial shifts in relative importance: Central, service- and workplace-heavy localities (Teusaquillo, Chapinero, Usaquén) lost relative relevance during lockdown, whereas localities with more adverse socioeconomic conditions (Kennedy, Ciudad Bolívar, Tunjuelito, San Cristóbal) gained relative relevance in the network. - Trip duration and distance patterns: Time-between-validations distribution remained bimodal. Long-lasting trips’ share declined from 42% pre-lockdown to 38% during lockdown; short-lasting trips increased from 58% to 62%. A left-shift of ~1 hour was observed. Distances are right-skewed, with substantial mass up to 14 km; long-lasting trips typically cover 4–16 km. These stable distributions suggest resilient trip patterns amid reduced volumes. - Socioeconomic correlations: Pre-lockdown correlations between flows and SES, informality, and poverty were weak. Post-lockdown, flows correlated positively with informality and poverty and negatively with SES; vulnerable populations showed drastic mobility reductions, reflecting targeted restrictions and self-protection. - Gravity model results (selected contrasts): • Before lockdown (origins): Lowest SES zones generated 35% fewer flows than SES 6; highest-informality zones 46% fewer than lowest; highest-poverty zones 52% fewer than lowest. • Before lockdown (destinations): Large differences by destination conditions: SESd −91%; Informalityd −78%; Povertyd about 10.8 times fewer flows for highest vs lowest poverty. • After lockdown (origins): Lower SES zones generated more flows: SES 1 had 54% larger flows than SES 6. Highest-informality zones generated 12% more flows than lowest; highest-poverty zones 24% more than lowest. • After lockdown (destinations): Differences by destination socioeconomic conditions modestly decreased but remained substantial (e.g., SESd ≈ −85%). • Distance effect: Negative and stronger after lockdown. Population effects at origin/destination became uniformly positive and stronger post-lockdown, implying flows more likely between more populated zones. • By trip type: Long-lasting trips show larger socioeconomic-driven differences for low SES/high informality zones, consistent with unequal feasibility of remote work. - National pattern: Facebook Movement Range data show that poorer municipalities exhibited smaller mobility reductions than wealthier cities during both full lockdown and partial reopening, aligning with Bogotá findings.
Discussion
Findings show that while stringent policies and individual choices substantially reduced mobility, the mobility network’s connectivity and trip pattern distributions remained resilient. The study addresses the research questions by demonstrating that: (1) Mobility volumes fell dramatically post-lockdown yet the city’s mobility structure preserved broad inter-zone connectivity; (2) Socioeconomic conditions critically shaped the magnitude of mobility reductions. Lower SES, higher informality, and higher poverty were associated with smaller reductions, indicating constraints on the ability to comply (e.g., inability to work from home, limited savings, necessity to access services). Origin-zone socioeconomic conditions more strongly explained changes than destination conditions, reflecting the network’s directionality and origin-driven necessities. These results underscore that mobility restrictions, absent income support and service decentralization, may impose disproportionate burdens on disadvantaged populations and hinder public health goals. The strengthened distance deterrence and increased role of population in flows post-lockdown reflect more localized, necessity-driven trips between populous zones.
Conclusion
The paper contributes by (i) characterizing Bogotá’s public-transport mobility network before and during COVID-19 lockdowns, showing large volume declines but persistent inter-zone connectivity and stable trip time/distance patterns; (ii) quantifying how socioeconomic conditions (SES, informality, poverty, vulnerability) shape heterogeneous mobility responses via correlation analyses and PPML gravity models; and (iii) extending evidence to the national scale using Facebook Movement Range data. Policy implications include the need for effective income support to enable compliance among informal and poor workers; decentralizing and digitizing essential services (health, legal, public/private services), improving internet access; and transport operations reforms (alternative routes, increased frequencies, staggering work hours, sanitation, cycling infrastructure) to manage demand and reduce contagion risk. Future research should systematically assess how socioeconomic constraints contribute to disease transmission dynamics and evaluate targeted interventions to mitigate these effects.
Limitations
- Mobility data capture only public bus systems (TM and SITP); trips by cars, taxis, and other modes are not observed, so total city mobility is underestimated. - Smart-card data lack exit validations, requiring inference of trips from consecutive validations; first-to-last daily validation approximates full daily movement but may miss mode changes and non-bus segments. - Some SITP stops lacked geolocation and were excluded; cards with anomalous validation patterns were removed, potentially biasing certain user groups (e.g., transport workers). - UPZ aggregation may mask intra-UPZ heterogeneity; socioeconomic indicators, while high-resolution at block level, may not fully capture dynamic economic conditions during the pandemic. - High collinearity among SES, informality, and poverty necessitated separate gravity model estimations, limiting joint effect identification.
Listen, Learn & Level Up
Over 10,000 hours of research content in 25+ fields, available in 12+ languages.
No more digging through PDFs, just hit play and absorb the world's latest research in your language, on your time.
listen to research audio papers with researchbunny