Environmental Studies and ForestryNature Communications
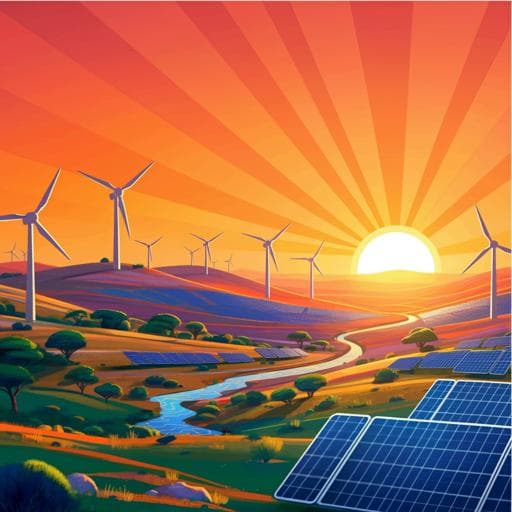
Avoiding ecosystem and social impacts of hydropower, wind, and solar in Southern Africa's low-carbon electricity system
G. C. Wu, R. Deshmukh, et al.
Explore the potential of low-impact energy sources in Southern Africa! This research by Grace C. Wu and colleagues highlights notable wind and solar capabilities but reveals critical socio-environmental challenges, particularly affecting hydropower. Discover how these findings can inform sustainable energy strategies in the region.
Related Publications
Explore these studies to deepen your understanding
Adjacent work that informs or extends this paper's methodology and findings.

Environmental Studies and Forestry
A new scheme for low-carbon recycling of urban and rural organic waste based on carbon footprint assessment: A case study in China
K. Zhou, Y. Li, et al.
Environmental Studies and Forestry
Equatorward shift of the boreal summer intertropical convergence zone in Maritime Continent and the impacts on surface black carbon concentration and public health
T. Huang, Y. Gu, et al.

Economics
Computable general equilibrium analysis of neutral carbon trading scheme and revenue recycling impacts on income distribution in China
L. Qi, L. Zhao, et al.

Health and Fitness
Impacts of social distancing policies on mobility and COVID-19 case growth in the US
G. A. Wellenius, S. Vispute, et al.


