Food Science and TechnologyCommunications Earth & Environment
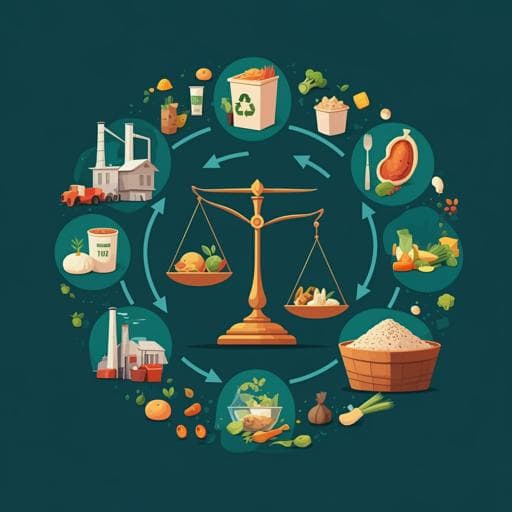
A framework to quantify mass flow and assess food loss and waste in the US food supply chain
W. Dong, K. Armstrong, et al.
Explore the staggering findings of a study that estimates the food loss and waste along the US food supply chain, revealing that a whopping 335.4 million metric tonnes were lost in 2016 alone! This study, conducted by Wenquan Dong, Kristina Armstrong, Mingzhou Jin, Sachin Nimbalkar, Wei Guo, Jie Zhuang, and Joe Cresko, offers insights into improving supply chain efficiency and sustainability through better food donation practices.
Related Publications
Explore these studies to deepen your understanding
Adjacent work that informs or extends this paper's methodology and findings.

Medicine and Health
Insights to the neural response to food cues in class III compared with class I and II obese adults using a sample of endometrial cancer survivors seeking weight loss
N. L. Nock, H. Jiang, et al.

Veterinary Science
A visualisation tool to understand disease prevention and control practices of stakeholders working along the poultry supply chain in southern India
C. Greru, R. Thompson, et al.

Social Work
Seeds and the city: a review of municipal home food gardening programs in Canada in response to the COVID-19 pandemic
J. Music, L. Mullins, et al.

Engineering and Technology
Emission impacts of China's solid waste import ban and COVID-19 in the copper supply chain
J. Ryter, X. Fu, et al.


