EconomicsNature Communications
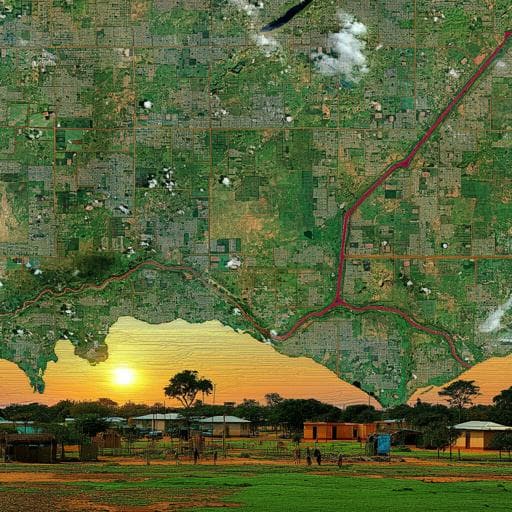
Using publicly available satellite imagery and deep learning to understand economic well-being in Africa
C. Yeh, A. Perez, et al.
Discover how advanced deep learning models are transforming economic research! A team of researchers from Stanford University and AtlasAI has harnessed the power of satellite imagery to predict asset wealth in 20,000 villages across Africa. This innovative approach not only reveals significant wealth variations but also provides insights into wealth changes over time. Dive into this groundbreaking study and explore its practical implications for policy and research.
Related Publications
Explore these studies to deepen your understanding
Adjacent work that informs or extends this paper's methodology and findings.
Environmental Studies and Forestry
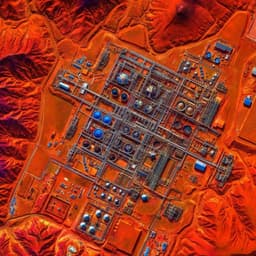
Deep learning for detecting and characterizing oil and gas well pads in satellite imagery
N. Ramachandran, J. Irvin, et al.

Psychology
Using machine learning to understand social isolation and loneliness in schizophrenia, bipolar disorder, and the community
S. J. Abplanalp, M. F. Green, et al.

Psychology
Building machine learning prediction models for well-being using predictors from the exposome and genome in a population cohort
D. H. M. Pelt, P. C. Habets, et al.

Economics
Utilizing mutual learning in literature and cultural industry finance in order to realise green economic recovery and sustainability
C. Wang, J. Zhang, et al.


