Medicine and Health
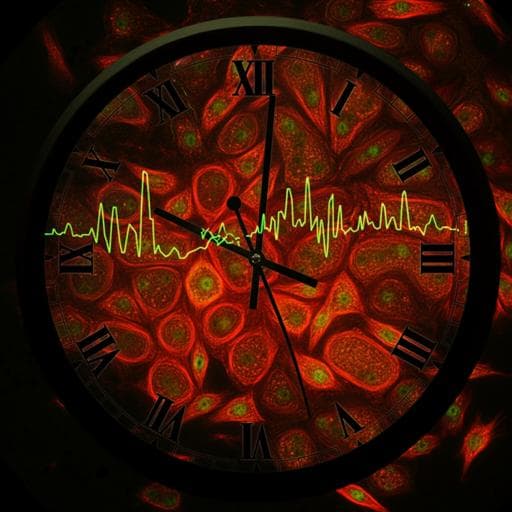
Time-of-day effects of cancer drugs revealed by high-throughput deep phenotyping
C. Ector, C. Schmal, et al.
This groundbreaking research by Carolin Ector and colleagues unveils a novel, high-throughput method that seamlessly combines live imaging and data analysis to deeply phenotype cancer cell models. Discover how this approach uncovers optimal treatment windows and responsive drug combinations by evaluating circadian rhythms and drug responses, paving the way for more effective cancer therapies.
~3 min • Beginner • English
Introduction
The study addresses how circadian rhythms shape cancer drug responses and seeks to determine optimal times of day for treatment, identify which cell subtypes benefit most, and uncover cellular features driving time-of-day (ToD) sensitivity. The circadian clock coordinates rhythmic biological processes across organisms and tissues, with a large fraction of genes showing tissue-specific rhythmic expression. Disruption of the circadian system is linked to carcinogenesis and poor outcomes across cancer subtypes. Prior work shows drug efficacy and toxicity vary with dosing time, but practical methods to identify optimal treatment windows have been lacking. The authors introduce an integrated experimental-computational framework to deeply phenotype circadian rhythms, growth, and drug responses in tumor and non-malignant cell models and to systematically profile ToD drug sensitivities, aiming to inform chronotherapy by maximizing tumor kill while minimizing toxicity to healthy tissue.
Literature Review
Background evidence highlights circadian regulation of metabolism, proliferation, immune function, DNA repair, and apoptosis; large-scale transcriptomic studies report 40–80% rhythmic gene expression in mammals depending on tissue and species. Circadian disruption is associated with cancer development and progression, and mutations in clock genes correlate with lower survival. Multiple studies demonstrate time-of-day specificity for chemotherapeutic efficacy and toxicity (e.g., 5-FU, doxorubicin, cisplatin, oxaliplatin), motivating chronotherapy. However, standardized, high-throughput approaches to determine optimal dosing times across models and drugs have been limited.
Methodology
Experimental design integrated: (1) Deep circadian phenotyping using dual luciferase reporters driven by Bmal1 and Per2 promoters in multiple cancer and non-malignant cell models. Cells were synchronized with dexamethasone and recorded for bioluminescence at 10-min intervals over 5 days. Three complementary time-series analyses were applied: autocorrelation (AC) to assess periodicity and stability; continuous wavelet transform (CWT) to quantify time-resolved period and ridge length; and multiresolution analysis (MRA) to decompose signal variance into noise (1–4 h), ultradian (4–16 h), circadian (16–32 h), and infradian (32–48 h) components, yielding a circadianicity metric. A global circadian strength (GCS) was computed by min–max scaling and averaging AC peak, CWT ridge length, and MRA circadianicity. (2) Growth dynamics via long-term live-cell imaging (Incucyte) using a nuclear mKate2-NLS reporter and brightfield confluency measurements. Frame-by-frame nuclei counts and confluency yielded growth trajectories, exponential growth rates (k), and doubling times across 10 breast-derived lines (TNBC subtypes BL1, BL2, MES, and non-malignant MCF10A). (3) Drug sensitivity profiling with time-resolved dose–response imaging for seven to eight drugs targeting DNA synthesis (5-FU, doxorubicin), DDR (cisplatin, olaparib), mitosis (alisertib, paclitaxel), and PI3K/AKT/mTOR (torin2, alpelisib, adavosertib). Growth rate inhibition (GR) metrics (GR50, GEC50, GRinf, Hill coefficient, GRAOC) were derived by fitting GR dose–response curves; EC50 from endpoint counts was also computed. (4) Time-of-day (ToD) screening used a streamlined resetting-and-dosing paradigm: three dexamethasone resets at 0, 4, and 8 h created distinct circadian phases; a single concentration near half-maximal effect was applied 32 and 48 h after the first reset, yielding six relative circadian times (0, 4, 8, 16, 20, 24 h). Responses were normalized to cell number at treatment time and evaluated over identical 96-h post-treatment windows. ToD response curves (ToD-RCs) were referenced to 0 h; ToD maximum range (ToDMR) quantified within-day variability. U-2 OS wild-type and Cry1/2 double knockout lines were included to assess clock dependence. (5) Chronotherapeutic index: For each cancer versus MCF10A pair, times of maximum and minimum benefit were identified by maximizing the difference in ToD-RCs, and fold-change benefits were aggregated across drugs and models to rank cancer models and drugs for potential circadian-based scheduling. (6) Determinants of ToD variability: Pairwise linear regressions related ToDMR to circadian metrics (including Bmal1/Per2 amplitude, period, AC, ridge length, circadianicity), growth metrics (doubling time, growth rate), and drug sensitivity metrics (GR50, GEC50, GRinf, GRAOC, Hill). Dominance (Shapley) analysis assessed relative contributions of determinants in multivariate models across drugs. (7) Core clock gene analysis: Basal expression (CCLE DepMap) of 16 core clock genes was correlated (Spearman) with drug-specific ToDMR across TNBC lines; supervised linear discriminant analysis (LDA) discriminated high versus low ToDMR groups per drug; principal component analysis (PCA) explored gene loading patterns. Imaging, signal processing (pyBOAT, PyWavelets), and statistical analyses (MATLAB, Python sklearn/scipy) followed specified parameters with biological and technical replicates as detailed in Methods.
Key Findings
- Circadian strength across models: U-2 OS wild-type exhibited the strongest rhythms (median AC ≈ 0.74), while U-2 OS Cry1 single knockout and Cry1/2 double knockout showed markedly reduced AC (median −0.04, p=7.7×10⁻¹²; 0.09, p=1.4×10⁻¹⁰). Periods varied from ~21 h (HCC1806, U-2 OS SKO) to ~26 h (MDAMB468, MCF10A). U-2 OS DKO (34.8 h, p=8.2×10⁻¹⁰) and SH-SY5Y (~39.2 h) were outside the circadian range. CWT ridge lengths ranked U-2 OS highest (median 4.1 days), followed by MCF7, MDAMB468, MCF10A (3.4–3.8 days), with shorter ridges in Cry knockouts (SKO 1.9 days; DKO 1.5 days). MRA showed strong circadianicity in U-2 OS (~93%) with <1% noise; Cry1 SKO and Cry1/2 DKO reduced circadianicity to 59% (p=5.8×10⁻⁴) and 40% (p=2.0×10⁻⁵) and increased noise by 5.8-fold and 209-fold, respectively. Overall, several cancer lines (U-2 OS, MCF7, MDAMB468) retained robust clocks; GIMEN and HCC1806 showed impaired but present rhythms.
- Growth dynamics: Across 10 breast-derived lines, 4-day growth ranged ~2–16-fold; MDAMB468 reached 100% confluency by day 4 with ~5.3-fold increase. Growth rate k and doubling time were strongly anticorrelated (R2=0.83); doubling times from confluency and cell counts correlated (R2=0.69).
- Drug sensitivity metrics: Time-resolved GR analysis produced multi-parametric profiles (GR50, GEC50, GRinf, Hill, GRAOC). Distinct drugs at saturating GRinf doses yielded different temporal growth trajectories, underscoring dynamic phenotyping. Significant cross-parameter associations included GEC50, GR50, EC50 (p≤0.0001); Hill showed weaker correlations; GRinf and GRAOC minimally correlated with others.
- Time-of-day variability: Approximately 80 ToD profiles across 10 cell models and 8 drugs revealed drug- and model-specific ToD-RCs. ToDMR varied 2-fold across drugs (highest on average for cisplatin; lowest for alisertib) and across cell lines (highest for MCF10A; lowest for HCC38; among cancers, SUM149PT was highest). In U-2 OS, Cry1/2 dKO reduced ToD variability compared to WT: ToDMR decreased by 62% (cisplatin), 58% (paclitaxel), and 40% (5-FU), indicating clock dependence.
- Optimal treatment timing and chronotherapeutic index: Cancer versus MCF10A ToD-RCs often differed in phase; for HCC1937 with alisertib, antiphasic profiles revealed distinct maximum/minimum benefit times. Aggregated polar histograms identified cell line–specific preferred windows (e.g., HCC1937: 10–12 h and 18–20 h). Drug-specific distributions showed clear windows for 5-FU (8–10 h), while torin2 and paclitaxel exhibited broader variability. A chronotherapeutic index ranked cancer models and drugs by fold-change benefits versus MCF10A at maximum/minimum benefit times, differing from rankings based solely on within-model ToDMR.
- Determinants of ToD variability: Pairwise regressions highlighted Bmal1-based clock metrics as most associated with ToDMR. For 5-FU, ToDMR correlated with Bmal1 amplitude (r=0.8, R2=0.6) and Bmal1 circadianicity (r=0.7, R2=0.43). On average across drugs/metrics, amplitude showed the highest association (mean r≈0.43±0.02); adavosertib displayed the highest overall correlation to metrics among drugs (mean r≈0.39±0.03). Dominance analysis ranked Bmal1 amplitude as the top contributor to ToDMR variability (mean contribution ≈21.9%); Hill coefficient contributed least (≈9.9%). Contributions varied by drug (e.g., alpelisib strongly driven by Bmal1 amplitude; paclitaxel/adavosertib more evenly distributed determinants).
- Core clock gene expression: Overall, individual gene–ToDMR associations were modest; notable exceptions included paclitaxel ToDMR anticorrelations with Per3 (r=−0.88, R2=0.78) and Dbp (r=−0.72, R2=0.51). Across drugs, cisplatin showed the highest cumulative correlations (mean r≈0.40±0.21); among genes, Per2 had the strongest overall association (mean r≈0.48±0.20). LDA indicated drug-dependent discriminatory contributions (for paclitaxel: Cry2, Dbp, Per3 jointly ~46%); PCA loadings revealed gene-specific influences (e.g., Csnk1d and Clock for paclitaxel in PC1/PC2).
Discussion
The integrated framework demonstrates that many cancer cell models retain functional circadian oscillations, challenging the assumption of universally weak clocks in cancer. By coupling deep circadian phenotyping with dynamic growth and GR-based drug sensitivity, the study shows that drug efficacy varies significantly across circadian time and depends on both the cellular context and drug mechanism. Comparing tumor versus non-malignant ToD profiles operationalizes key goals of chronotherapy—maximizing tumor toxicity while minimizing harm to healthy tissue—and enables identification of optimal dosing windows and candidates for circadian-aligned scheduling via a chronotherapeutic index. Mechanistically, ToD variability is multifactorial: circadian clock features, particularly Bmal1 amplitude and circadianicity, are dominant determinants for several drugs (e.g., 5-FU, alpelisib), while growth and standard drug sensitivity metrics contribute variably by agent. Basal expression of core clock genes shows limited linear associations with ToDMR overall, though specific genes (Per3, Dbp, Per2) and multigene patterns (via LDA/PCA) provide discriminative insight, suggesting complex, drug-specific interactions between clock circuitry and pharmacological response. Collectively, the findings address the study’s core questions by providing (A) data-driven optimal dosing times, (B) identification of cell subtypes that benefit most, and (C) quantitative determinants linking circadian and pharmacodynamic features to time-dependent efficacy.
Conclusion
This work introduces a high-throughput experimental and computational platform to quantify circadian rhythms, growth, drug sensitivity, and time-of-day responses in cancer and non-malignant models. It reveals substantial ToD-dependent drug effects, identifies optimal treatment windows differing by cell model and drug, and proposes a chronotherapeutic index to prioritize contexts where circadian scheduling offers maximal therapeutic benefit. The study clarifies that circadian clock strength—especially Bmal1 amplitude—often dominates ToD variability, while contributions of growth and pharmacologic parameters are drug-specific. Although individual clock gene expression correlates weakly overall with ToD effects, multigene analyses uncover drug-dependent patterns. Future directions include extending the pipeline to 3D organoids and animal models, investigating mechanistic links between clock components, cell cycle, and drug targets, and exploring roles of ultradian rhythms in shaping ToD responses.
Limitations
- Reporter-based circadian measurements may be influenced by random lentiviral insertion sites despite population-level, non-clonal recordings and validation across reporters. - In vitro findings are not direct treatment recommendations; translation requires validation in more complex systems (e.g., organoids, animal models). - Time-of-day assays control for variable cell density at treatment, yet residual in vitro density effects cannot be fully excluded. - Basal gene expression analyses may miss time-dependent regulation or protein-level dynamics; redundancy within the clock network may mask individual gene effects. - Sample sizes for some drug–cell combinations (e.g., cisplatin) and metrics varied, potentially limiting statistical power for specific correlations.
Related Publications
Explore these studies to deepen your understanding of the subject.

