
The unquantified mass loss of Northern Hemisphere marine-terminating glaciers from 2000–2020
W. Kochtitzky, L. Copland, et al.
Explore these studies to deepen your understanding
Adjacent work that informs or extends this paper's methodology and findings.

The impact of mass gatherings on the local transmission of COVID-19 and the implications for social distancing policies: Evidence from Hong Kong
P. Zhu, X. Tan, et al.
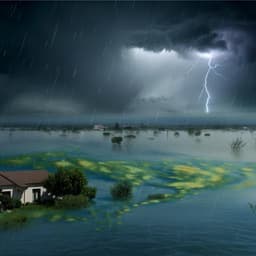
Seasonal predictability of the extreme Pakistani rainfall of 2022 possible contributions from the northern coastal Arabian Sea temperature
T. Doi, S. K. Behera, et al.
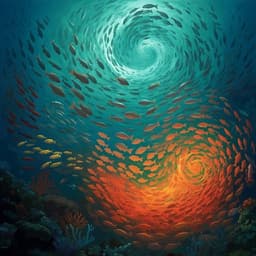
Future trends of marine fish biomass distributions from the North Sea to the Barents Sea
C. Gordó-vilaseca, M. J. Costello, et al.
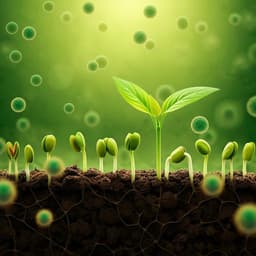
Utilization of lysed and dried bacterial biomass from the marine purple photosynthetic bacterium *Rhodovulum sulfidophilum* as a sustainable nitrogen fertilizer for plant production
S. R. Morey-yagi, Y. Kinoshita, et al.


