
The brain structure, immunometabolic and genetic mechanisms underlying the association between lifestyle and depression
Y. Zhao, L. Yang, et al.
Explore these studies to deepen your understanding
Adjacent work that informs or extends this paper's methodology and findings.
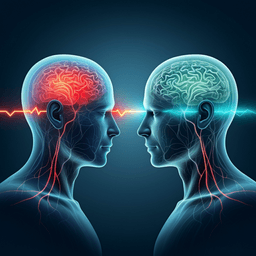
Brain-to-brain mechanisms underlying pain empathy and social modulation of pain in the patient-clinician interaction
D. Ellingsen, K. Isenburg, et al.

Association between sleep duration, depression and breast cancer in the United States: a national health and nutrition examination survey analysis 2009–2018
Y. Cai, Y. Zhaoxiong, et al.

Isoform-level transcriptome-wide association uncovers genetic risk mechanisms for neuropsychiatric disorders in the human brain
A. Bhattacharya, D. D. Vo, et al.

Dissecting the causal association between social or physical inactivity and depression: a bidirectional two-sample Mendelian Randomization study
G. Zhang, Z. Lu, et al.


