Earth SciencesNature Communications
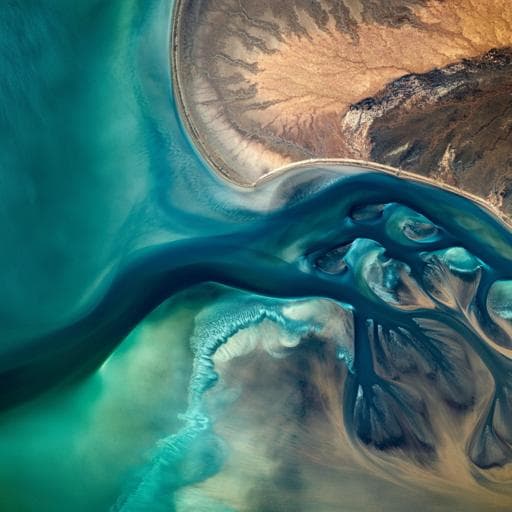
Sustained increase in suspended sediments near global river deltas over the past two decades
X. Hou, D. Xie, et al.
Join Xuejiao Hou, Danghan Xie, Lian Feng, Fang Shen, and Jaap H. Nienhuis as they explore global patterns of coastal suspended sediment concentration and river sediment plume area near deltas. This groundbreaking study reveals significant increases in sediment levels, posing intriguing questions about their implications for wetland resilience against climate change, all while navigating the complex influences of natural coastal processes.
Related Publications
Explore these studies to deepen your understanding
Adjacent work that informs or extends this paper's methodology and findings.

Earth Sciences
Arctic warming contributes to increase in Northeast Pacific marine heatwave days over the past decades
S. Song, S. Yeh, et al.

Environmental Studies and Forestry
Country-level energy demand for cooling has increased over the past two decades
E. Scoccimarro, O. Cattaneo, et al.

Earth Sciences
Recent two decades witness an uptick in monsoon depressions over the northern Arabian Sea
N. Chilukoti, M. Nimmakant, et al.

Earth Sciences
Slow-down in summer warming over Greenland in the past decade linked to central Pacific El Niño
S. Matsumura, K. Yamazaki, et al.


