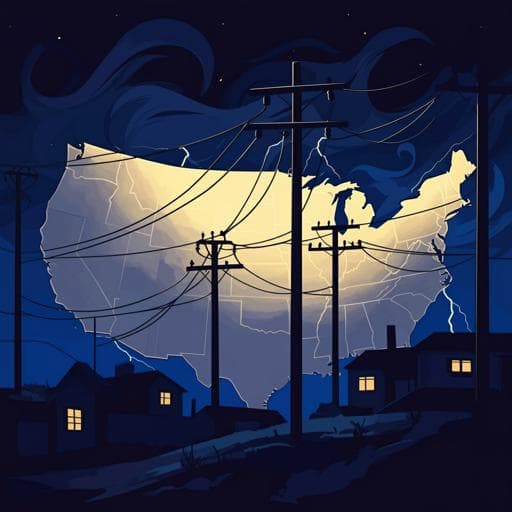
Introduction
Power outages pose a significant threat to public health, particularly for vulnerable populations. The frequency and duration of outages are expected to increase due to climate change, aging infrastructure, and rising energy demands. Existing research often focuses on single, large-scale events, lacking comprehensive national-level data at a fine spatial resolution. This study addresses this gap by analyzing hourly, county-level power outage data from 2018–2020 across the contiguous United States, aiming to characterize the spatiotemporal distribution of outages, their association with climate events, and the overlap with social and medical vulnerability. Understanding these patterns is crucial for developing equitable disaster preparedness and response strategies and for prioritizing resource allocation to vulnerable communities.
Literature Review
Previous research on power outages and their health impacts has primarily focused on large-scale events, often using the timing and location of disasters as proxies for outage exposure, rather than precise measures of customer-hours without power. Studies have shown negative health effects of power outages, including carbon monoxide poisoning, increased cardiovascular and respiratory issues, heatstroke, hypothermia, and exacerbation of chronic diseases. Certain groups, particularly those reliant on electricity-dependent durable medical equipment (DME), under-resourced communities, and historically marginalized populations, are more vulnerable to the negative consequences of outages. While severe weather is a major driver of large-scale outages, there's limited research on the link between environmental events and smaller-scale, more frequent outages. The lack of standardized methods for measuring health-relevant power outages and the absence of national datasets with sufficient temporal and spatial resolution have hindered comprehensive studies. This study aims to fill this gap by creating new metrics for characterizing power outages and examining the relationships with climate events and vulnerability factors.
Methodology
The study used hourly, county-level power outage data from PowerOutage.us for 2018–2020. Data quality checks were performed, resulting in a final dataset encompassing 2447 counties (73.7% of the US population). Two main outage metrics were created: a relative metric (percent of customers without power exceeding 0.1% of total county customers) to account for population size differences and an absolute metric (total customer-hours without power) representing the total burden. Outages were categorized by duration (1+ hour and 8+ hour, the latter considered medically relevant). Severe weather and climate events (heavy precipitation, snowfall, anomalous heat/cold, lightning, tropical cyclones, and wildfires) were identified from multiple data sources and linked to outage events. Social vulnerability was assessed using the CDC's Social Vulnerability Index (SVI), and medical vulnerability was measured by the prevalence of Medicare DME users per 1000 beneficiaries, obtained from the HHS emPOWER dataset. Bivariate LISA analysis was used to identify clusters of counties with high outage exposure and high social or medical vulnerability. Statistical analyses included descriptive statistics, co-occurrence ratio calculations, Wilcoxon rank sum tests, and bivariate LISA analysis to examine associations between outage metrics and vulnerability factors.
Key Findings
The study found that across the 2447 included counties, an average of 520 million customer-hours were lost annually due to power outages. The annual average number of 8+ hour outages per county ranged from 0 to 35, and 70.5% of counties experienced at least one such outage during the study period. The highest average counts of 8+ hour outages were concentrated in the South, Northeast, and Appalachia. Louisiana, Texas, Michigan, Mississippi, and North Carolina experienced the highest annual average counts of these medically relevant outages. The spatial distribution of 1+ hour outages largely mirrored that of 8+ hour outages but with wider geographic spread. The states with the highest number of counties in the top decile of 1+ hour and 8+ hour outages were Louisiana, Texas and Michigan. The total customer hours without power each year were found to average 5.2 million, with Louisiana, North Carolina, California, Texas, and New York leading in this metric. Analysis of co-occurrence with extreme weather revealed that 62.1% of 8+ hour outages co-occurred with at least one severe weather or climate event. Outages were 3.4 times more common on days with a single event and 10 times more common on days with multiple events. Heavy precipitation was the most common event associated with 8+ hour outages, followed by anomalous heat and tropical cyclones. Seasonal patterns emerged, with heavy precipitation dominating year-round, snowfall prominent in winter, and wildfires and tropical cyclones affecting certain seasons. In counties within the highest SVI quartile, there was a significantly higher median annual count of both 1+ and 8+ hour outages, compared with counties in the lowest SVI quartile. Counties in the highest quartile of Medicare DME use prevalence surprisingly showed lower median annual 8+ hour outage counts, although DME users remain highly vulnerable during outages. Bivariate LISA analysis revealed clusters of counties with high 8+ hour outage exposure and either high SVI or high DME use prevalence, particularly concentrated in Louisiana, Mississippi, Arkansas, and Michigan. These high-high clusters had significantly higher proportions of racial and ethnic minorities, individuals below 150% of the poverty level, and those living in mobile homes compared to other counties.
Discussion
This study provides the most comprehensive, sub-state analysis of power outages in the US to date, demonstrating the widespread impact of outages and their disproportionate effects on vulnerable populations. The strong association between outages and severe weather events highlights the increasing influence of climate change. The findings underscore the need for more equitable disaster preparedness and response strategies. The observed clustering of high outage exposure and vulnerability in specific regions points towards the importance of targeted interventions and resource allocation. The combined use of relative and absolute outage metrics provides a more complete understanding of both the burden of outages and the disparities in their impact. The study emphasizes the need for improved data collection at finer spatial resolutions to better understand the sub-county heterogeneity of outage exposure and to enable more precise targeting of interventions.
Conclusion
This study presents a comprehensive analysis of power outage distribution, duration, and vulnerability across US counties, revealing considerable disparities and emphasizing the role of climate change. The findings underscore the need for targeted interventions and resource allocation to protect vulnerable communities. Future research should focus on improving data granularity, exploring the causal relationship between climate events and outages, and refining vulnerability metrics to inform more effective policy and preparedness strategies.
Limitations
The study's limitations include the reliance on PowerOutage.us data, which may not capture all US utilities, particularly small, rural ones. Data availability varied across counties, limiting the analysis' geographic scope. The three-year study period prevents analysis of long-term trends. County-level aggregation masks sub-county heterogeneity in outage exposure. The vulnerability metrics, while informative, are not specifically designed for power outages and may not fully capture all relevant factors. Finally, the study identifies co-occurrence but cannot establish causality between climate events and outages.
Related Publications
Explore these studies to deepen your understanding of the subject.