Environmental Studies and Forestry
Spatially explicit analysis identifies significant potential for bioenergy with carbon capture and storage in China
X. Xing, R. Wang, et al.
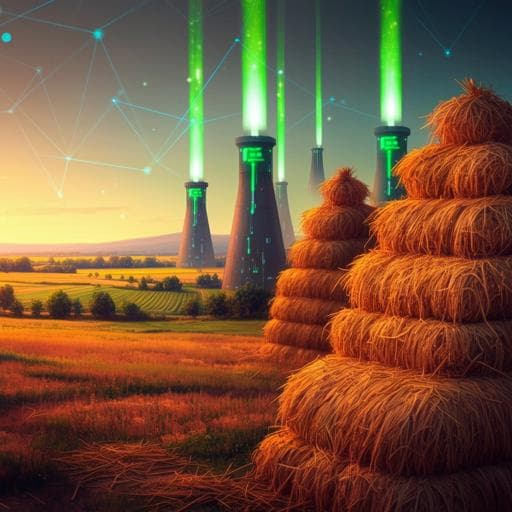
This research reveals an astounding potential of 222 GW capacity for decarbonizing China's power sector using bioenergy with carbon capture and storage (BECCS). Conducted by a team of experts including Xiaofan Xing and Rong Wang, the study tackles the challenges and uncertainties surrounding economic costs and emissions associated with co-firing biomass from agricultural and forestry residues.
~3 min • Beginner • English
Introduction
Biomass utilization combined with carbon capture and storage (BECCS) is a key negative emissions option aligned with Paris Agreement targets. With atmospheric CO2 at 415 ppm in 2019 and a rapidly depleting carbon budget, China—responsible for about 10% of historical warming and the largest current emitter—faces the challenge of decarbonizing a coal-dominated power system with relatively young assets. China also has vast agricultural and forestry residues that could be valorized for electricity, benefiting rural income and air quality. However, BECCS deployment must overcome challenges around sustainable biomass availability, acquisition and pretreatment costs, water and fertilizer requirements, life-cycle GHG emissions, plant retrofits for high-ratio co-firing and CCS, CO2 transport to storage, efficiency penalties, energy system inertia, and public perception. The study’s purpose is to analyze the potential and barriers to a carbon emission-negative power system in China via BECCS. The central hypothesis is that BECCS can be harnessed by integrating: (1) biomass utilization (collection, pretreatment of residues, and energy crop production), (2) retrofitting coal plants for up to 90% biomass co-firing and CCS, and (3) pipeline transport of CO2 to geological storage. The study builds a spatially explicit, county-level life-cycle cost and emissions optimization to estimate marginal abatement costs and identify logistical constraints and opportunities.
Literature Review
Previous estimates of BECCS costs and potentials have been made at regional and national scales, with spatially explicit analyses applied in some countries (e.g., Japan, South Korea) and a marginal cost curve developed for western North America. For China, prior work suggested affordable capture costs at power plants but lacked comprehensive assessment of biomass and CO2 transport logistics. Studies on biomass resource potentials in China vary by scope and methodology; the present work’s 2015 estimates for agricultural residues are near the upper bound of prior ranges, forestry residue estimates align with several studies, and energy crop potential (based on 2015 land-use and Miscanthus yields) is near the median of previous assessments. Literature indicates BECCS could be cost-competitive in IGCC configurations, but differences in accounting for logistics and transport can shift cost estimates. Broader energy system literature shows BECCS costs comparable to wind and solar but higher than hydropower and nuclear, noting constraints on the expansion of the latter two.
Methodology
The study assembles a county-level (2836 counties) spatial database for 2015 covering 21 lignocellulosic biomass feedstocks (11 agricultural residues and 8 forestry residue types, plus dedicated energy crops on suitable marginal lands and grasslands), coal-fired power plant capacities, GDP, and geological CO2 storage capacity (deep saline aquifers, depleted oil/gas fields, deep coal seams) onshore and offshore. Biomass quantities are derived from national statistics (China Statistics Yearbook, China Forestry Statistical Yearbook) and FAO data, estimating agricultural residues using crop-specific straw-to-grain ratios linked to harvested grain. Energy crop suitability is filtered by climate thresholds (≥−23 °C minimum monthly mean; ≥400 mm annual precipitation) using 2015 land-use maps, with yields estimated from climatic variables for Miscanthus and from a global best-yield crop map. Life-cycle unit costs include biomass acquisition (field operations, land, labor, soil remediation where applicable), fertilizers (N, P2O5, K2O), biomass transport (distance-cost functions with diesel use), CO2 transport (pipeline cost model using McCollum–Ogden equations with location/terrain factors, capital recovery, and capacity constraints), biomass pretreatment (drying, grinding, torrefaction, pelletization), water for irrigation and CCS/cooling, retrofitting costs for co-firing and CCS, and CO2 capture and storage costs. Life-cycle emissions account for pretreatment/harvest energy use, fertilizer production and application, biomass transport, retrofit electricity use, land-use change impacts (zero on marginal lands, 30±3% of biomass CO2 on grasslands), avoided emissions from substituted coal, and captured CO2. Electricity generation efficiencies are specified: baseline coal PC 39.3%; 90% biomass co-firing without CCS 36.2%; with CCS 25.1%; 30% co-firing with CCS 27.3%; IGCC 35.8%. An optimization minimizes total cost subject to a specified national net CO2 emission reduction target, with constraints on biomass availability (in-county, intra-province, inter-province logistics), power plant generation capacity by county, and CO2 storage capacities (in-county, intra-province, inter-province). A linear programming framework (MATLAB linprog) solves for biomass allocation and CO2 transport cases, including a routing variant that allows biomass transport among the nearest ten counties to capture higher transport cost realism. CO2 pipeline networks are approximated via hierarchical county–province–national nodes with distance proxies based on areal radii; minimum and maximum pipeline flow capacities are enforced. Uncertainty is assessed with Monte Carlo simulations varying costs, emissions factors, carbon content, and ±50% transport distance uncertainties for inter-county/province cases. Scenario analyses explore alternative co-firing ratios (30% vs 90%), plant technologies (PC vs IGCC), biomass composition (residues only vs energy crops, best-yield crops), electricity demand levels (2015 vs projected 2030), CCS vs no-CCS variants, and explicit biomass transport routing.
Key Findings
- Biomass supply potential: 3.04 Gt dry matter per year (agricultural residues 0.79 Gt, forestry residues 0.31 Gt, energy crops on marginal lands 0.32 Gt, energy crops on grasslands 1.62 Gt), equivalent to 58 EJ yr⁻¹ and 5.24 Gt CO2 yr⁻¹ of biogenic carbon. At 90% co-firing with 25.1% efficiency, this yields 4.03 PWh yr⁻¹ electricity from biomass plus 0.59 PWh yr⁻¹ from co-fired coal, supplying about 80% of 2015 demand or 49% of projected 2030 demand.
- Storage feasibility: With 90% capture, 4.72 Gt CO2 yr⁻¹ could be captured from biomass combustion; theoretical geological storage of ~2,823 Gt CO2 (onshore and offshore) would take ~600 years to fill at that rate, ignoring logistics.
- Spatial logistics: Biomass resources are concentrated in central, southern, and northeastern rural regions; suitable energy crop lands in southwest and northeast; coal plants mainly central/southeast; storage mostly west and northeast. About 0.3 Gt yr⁻¹ biomass can be burned with capture and storage within the same county; 0.6 and 1.3 Gt yr⁻¹ require intra- and inter-provincial transport, respectively. CO2 transport needs are ~2.0 Gt yr⁻¹ intra-provincial and 0.8 Gt yr⁻¹ inter-provincial.
- Retrofit potential: 222 GW of existing capacity can be fueled by 0.9 Gt yr⁻¹ biomass within the same county, enabling avoidance of 1.0±0.1 Gt CO2 yr⁻¹ from coal and removal of 1.4±0.1 Gt CO2 yr⁻¹ via capture/storage.
- Marginal abatement costs (Scenario B90-2015-PC): increase from about $49 to $103 per t CO2-eq when abating 0–2 Gt CO2-eq yr⁻¹; around $180±220 for 3 Gt, $292±350 for 4 Gt, and ~$309 with large uncertainty for 5 Gt. For comparison, IGCC BECCS in literature shows $42–52 per t CO2-eq, whereas this study’s comparable point is ~$68 due to including transport/logistics.
- Technology/scenario effects: 30% co-firing slightly lowers marginal cost at modest abatement (e.g., $62 vs $68 per t at ~0.88 Gt) but reduces maximum abatement potential from 5.3 to 1.8 Gt CO2-eq yr⁻¹. Shifting PC to IGCC raises cost to ~$153 per t. Using only energy crops increases cost to ~$204 per t; using best-yield crops changes costs slightly. CCS-only (no biomass) increases cost to ~$110 per t at 1 Gt vs ~$70 with BECCS; biomass co-firing without CCS is ~$80 per t at 1 Gt and can approach zero cost at shallow abatement (0.1 Gt) due to coal substitution value, but becomes expensive beyond ~1 Gt due to biomass logistics, making CCS preferable for deep decarbonization.
- Cost and emissions breakdown at 2 Gt abatement: Avoided coal emissions 0.93±0.02 Gt CO2 yr⁻¹ via 1.12 PWh electricity (0.92 PWh agricultural residues, 0.18 PWh fuelwood). Geological sequestration 1.35±0.09 Gt CO2 yr⁻¹. Life-cycle emissions offset 0.28±0.11 Gt CO2-eq yr⁻¹ (retrofits ~3.4 Mt, biomass logistics ~200 Mt, fertilizers ~80 Mt, LUC negligible for grasslands scenario). Marginal cost of $103 per t decomposes to: biomass acquisition/pretreatment ~$48/t, CCS ~$35/t, retrofits ~$29/t, biomass transport ~$15/t, water ~$4/t, fertilizers ~$3/t, CO2 transport ~$3/t, offset by coal substitution income −$34/t.
- Electricity price impacts: To abate 1, 3, 5 Gt CO2-eq yr⁻¹, bioelectricity required is ~0.55, 1.74, 3.34 PWh yr⁻¹, increasing average electricity price from $0.060/kWh (coal) to ~$0.075, $0.129, and $0.253/kWh, respectively.
- Spatial concentration: A small share of counties produces a large share of bioenergy; for 1 Gt abatement, 11% of counties produce 50% of bioenergy (3.97 EJ) and incur 50% of costs ($32.8B/yr). At 3 and 5 Gt, 50% of bioenergy comes from 18% and 13% of counties, respectively.
- Provincial contributions: For 1 Gt abatement, major contributors include Shandong (1.12 EJ/yr, $9.2B/yr), Henan (0.99 EJ/yr), Jiangsu (0.76 EJ/yr), Hebei (0.69 EJ/yr). At 5 Gt, Sichuan (5.41 EJ/yr), Yunnan (3.49 EJ/yr), Qinghai (3.19 EJ/yr), Tibet (2.74 EJ/yr) dominate.
- Aggregate annual costs: ~$64, $293, and $819 billion per year for 1, 3, and 5 Gt abatement, with ~29–37% for biomass acquisition and ~8–12% labor, potentially boosting rural incomes.
- Soil sustainability sensitivity: Limiting to 50% sustainable residue removal shifts the marginal cost curve left (reduces achievable abatement for a given cost); adding soil remediation (e.g., plastic mulch at ~$76/ha/yr) only slightly changes costs.
- 2021–2030 decarbonization role: Power sector cumulative emissions baseline 53 Gt CO2-eq (no WWSN or BECCS expansion) fall to 47 Gt under current WWSN policies. Investing ~$2.3T (1% GDP) in BECCS from 2021–2030 can reduce emissions by 21 Gt; ~$7.4T can achieve power-sector carbon neutrality by 2030. To keep the sector within 5% of the remaining 2 °C global carbon budget for 2021–2030 (31.4 Gt), ~0.5% GDP investment ($1.1T) in BECCS is needed, delivering ~1.1 PWh/yr at ~$82/t.
Discussion
The findings support the hypothesis that large-scale BECCS in China is technically and economically feasible when spatial logistics are explicitly considered. A substantial portion of decarbonization can be achieved by retrofitting existing coal assets, mitigating stranded asset risks while leveraging abundant residues and suitable lands for energy crops. BECCS delivers combined benefits of avoided fossil emissions and net removals, with marginal costs competitive with wind and solar for moderate abatement levels and lower than CCS-only for deep decarbonization due to the added carbon removal. However, spatial mismatches among biomass supply, plant locations, and storage basins create significant transport demands that shape the marginal cost curve, emphasizing the importance of optimized biomass sourcing and CO2 pipeline networks. The county-level analysis highlights geographic hotspots for cost-effective deployment and identifies regions where costs as a share of GDP are higher, informing equitable policy design. Integrating BECCS with planned expansions of hydropower, wind, solar, and nuclear enables pathways that exceed current NDC ambitions and can approach sectoral carbon neutrality by 2030 with sufficient investment. The analysis also underscores environmental safeguards (soil management for residue removal) necessary to sustain long-term biomass supply without degrading land resources.
Conclusion
This study provides a spatially explicit, life-cycle cost optimization of BECCS deployment across 2836 counties in China, quantifying resource potentials, logistics, marginal abatement costs, and regional deployment patterns. Key contributions include: (1) identifying 222 GW of existing coal capacity that can be retrofitted and fueled by 0.9 Gt/yr biomass locally, (2) deriving national marginal cost curves across multiple scenarios with explicit biomass and CO2 transport logistics, and (3) mapping bioenergy and cost hotspots to guide targeted policies and infrastructure planning. BECCS can cost-competitively deliver 1–2 Gt CO2-eq/yr reductions/removals by 2030 and, with greater investment, contribute to power-sector carbon neutrality. Future research should: improve spatial resolution and validation of biomass supply chains; monitor and manage soil health impacts of residue removal; refine feasibility and efficiency of high-ratio co-firing; design detailed CO2 pipeline routing with terrain and permitting constraints; evaluate social acceptance and just transition aspects; and integrate BECCS planning with broader energy system transformations and water resource management.
Limitations
- Logistics and routing simplifications: Biomass and CO2 transport were approximated using county/provincial categories and nearest-ten-county routing due to computational limits, with simplified distance proxies and pipeline flow assumptions; true routes, terrain, permitting, and right-of-way constraints may alter costs.
- Technology assumptions: High co-firing ratios (up to 90%) and associated efficiency penalties/retrofit costs are based on literature; real-world feasibility, operational performance, and outage risks could differ.
- Storage lifetime and capacity: A 30-year effective storage lifetime per site and national storage capacity estimates carry uncertainty; injectivity and site-specific constraints are not fully modeled.
- Biomass sustainability: Assumptions on sustainable residue removal and energy crop land-use (marginal lands/grasslands) may not capture local soil carbon, erosion, biodiversity, or competing land-use values.
- Cost/emission parameters: Life-cycle costs and emission factors (fertilizers, transport, pretreatment, retrofits, CCS) involve uncertainty, addressed via Monte Carlo but still subject to data limitations and future market dynamics.
- Electricity demand and policy trajectories: Projections of 2030 electricity demand, WWSN growth, GDP, and investment availability are uncertain and policy-dependent.
- CO2 transport network: Pipeline sizing, utilization thresholds, and hierarchical aggregation assumptions may not reflect optimal or phased infrastructure development.
Related Publications
Explore these studies to deepen your understanding of the subject.

