
Earth Sciences
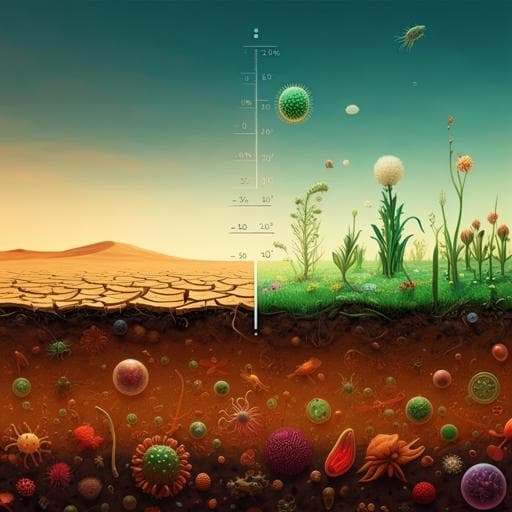
Soil microbial diversity-biomass relationships are driven by soil carbon content across global biomes
F. Bastida, D. J. Eldridge, et al.
This study by Felipe Bastida, David J. Eldridge, Carlos García, G. Kenny Png, Richard D. Bardgett, and Manuel Delgado-Baquerizo explores the fascinating link between soil microbial diversity, biomass, and soil carbon content across various biomes. Dive into the implications of environmental changes on these relationships and discover how they might impact soil processes!
~3 min • Beginner • English
Introduction
The study addresses how soil microbial diversity and biomass are related across globally distributed biomes and the environmental drivers regulating this relationship. Building on the long-debated diversity–biomass (or productivity) relationships in plant communities, including the humped-back model, the authors note that analogous global-scale patterns for belowground microbial communities remain poorly understood. They hypothesize that soil carbon (C) content is a key driver of the relationship between soil microbial diversity and biomass and propose a standardized microbial diversity-to-biomass ratio as an integrative proxy for their linkage. Two conceptual frameworks are considered: (1) the Stress Gradient Hypothesis, predicting relatively higher diversity compared to biomass (higher diversity-to-biomass ratio) under stressful, low-C soils typical of arid and cold systems due to facilitation and specialization; and (2) competitive exclusion in high-C environments, predicting increased biomass and decreased diversity, yielding lower diversity-to-biomass ratios and a humped-back diversity–biomass relationship. Given that broad processes like soil respiration are often more closely tied to microbial biomass, the authors also posit that higher diversity-to-biomass ratios could be associated with lower rates of organic matter mineralization at broad scales. Understanding these relationships is crucial in the context of global change drivers (land-use intensification, climate change) that alter soil C.
Literature Review
Prior work in plant ecology suggests a unimodal (humped-back) diversity–biomass relationship driven by resource availability and competitive exclusion at high biomass, and positive associations under low biomass conditions. For soil microbial communities, evidence on diversity–biomass linkages across biomes is limited. Some studies argued competitive exclusion is less important belowground due to spatial separation, though recent evidence indicates competitive interactions do occur in polar and other soils. Soil C flows fuel belowground productivity and microbial biomass, and several within-biome and experimental studies show strong correlations between soil organic C and microbial diversity. Because soil C is sensitive to global change (climate and land-use intensification), shifts in C could alter microbial diversity-to-biomass balance. Mechanistic modeling approaches (e.g., structural equation modeling) used in plant studies have been advocated to clarify these relationships in soils.
Methodology
Study design: A cross-biome field survey was conducted in 2016–2017 across 87 locations spanning nine countries and five continents, encompassing diverse vegetation types (cold, dry, temperate, tropical forests; shrublands; grasslands; forblands; moss heaths; croplands) and climates (tropical, temperate, continental, polar, arid). At each location, a 50×50 m plot was established and five composite soil samples (each from five 0–10 cm cores) were collected under dominant plant species, totaling 435 samples. Vegetation cover was measured along three 30 m transects using the line-intercept method. Samples were sieved (<2 mm); subsamples were frozen (−20 °C) for microbial analyses and air-dried for chemistry.
Soil properties: Electrical conductivity, pH (1:2.5 soil:water), texture (% clay + silt), available P (Olsen P), total N (LECO CHN628), and soil organic C (SOC, %) were determined with standardized protocols. Ranges: SOC 0.1–38%; available P 0.5–72 mg P kg⁻¹; pH 3.8–9.1; clay+silt 0.3–86%.
Microbial biomass and respiration: Microbial biomass was estimated via PLFAs from 0.5 g freeze-dried soil using Bligh and Dyer extraction modified by Buyer and Sasser. FAMEs were analyzed on an Agilent 7890B GC with DB-5 ms column. Bacterial biomarkers included i15:0, a15:0, 15:0, i16:0, 16:1ω7, 17:0, i17:0, a17:0, cy17:0, 18:1ω7, cy19:0; fungal biomass was indexed by 18:2ω6. Microbial respiration was measured per plot (n=87) as CO₂ released over 16 days from 1 g soil incubated at 28 °C and 50% WHC in darkness after 1-week pre-incubation. The authors note 18:2ω6 can originate from other eukaryotes but is often well correlated with ergosterol.
Microbial diversity: DNA was extracted (PowerSoil kit) from 10 g frozen soils (n=435). Amplicon sequencing targeted bacterial 16S (515F/806R) and eukaryotic 18S rRNA genes (Euk1391f/EukBr) on Illumina MiSeq. Bioinformatics used QIIME, USEARCH, and UNOISE3 to generate ASVs at 100% identity. ASV tables were rarefied to 5000 (bacteria) and 2000 (fungi) sequences per sample to standardize depth. Rarefaction sensitivity analyses with higher depths (bacteria 18,000; fungi 10,000) showed very high correlations (r>0.98; p<0.001) in diversity and community composition, indicating robustness to rarefaction choice.
Richness-to-biomass ratio: Bacterial and fungal richness and biomass were min–max scaled to 0–1 and their ratios computed to provide a standardized diversity-to-biomass index.
Statistical analyses: Differences in microbial biomass and richness among ecosystem types were tested using one-way PERMANOVA and ANOVA. Random Forest (rfPermute) identified predictors of microbial richness. Linear and quadratic models characterized biomass–richness relationships, selecting best fits via AIC. Structural equation modeling (SEM) assessed direct and indirect effects of abiotic (pH, SOC, texture), biotic (microbial biomass, dominant vegetation type, plant cover), and climatic (MAT, MAP) variables on richness and on the richness-to-biomass ratio, with bootstrap tests for non-normal data and composite variables for interpretability.
Global mapping: The Cubist regression-tree model predicted global distributions of microbial biomass and richness-to-biomass ratios at 25 km resolution using SOC, pH, texture, MAT, MAP, and major vegetation types (forests, grasslands). Covariates were sourced from SoilGrids (ISRIC), WorldClim, and Globcover2009 (ESA). Independent cross-validation was limited by the lack of global datasets containing both diversity and biomass.
Key Findings
- Across global biomes, microbial biomass and diversity exhibit a unimodal (humped-back) relationship for both bacteria and fungi; this pattern persists after excluding tropical soils with the highest biomass.
- SEM indicates that soil carbon (SOC) indirectly regulates microbial diversity through its strong positive association with microbial biomass. SOC is a fundamental driver of the richness-to-biomass ratio for both bacterial and fungal communities.
- SOC correlates positively with both microbial biomass and richness, but the SOC–biomass relationship is stronger (steeper slope) than the SOC–richness relationship. Consequently, the standardized richness-to-biomass ratio declines with increasing SOC across biomes.
- Converting PLFA data to microbial biomass C yielded an SOC–microbial biomass C slope of 0.041, exceeding earlier reported slopes (0.013; 0.009), suggesting SOC changes from land use, deforestation, or climate could more strongly influence microbial biomass than previously estimated.
- The negative SOC–richness-to-biomass relationship holds across ecosystem types, except for the fungal community in moss heaths.
- Biome patterns: High-C soils (e.g., tropical regions) tend to have higher microbial biomass but comparatively lower richness than low-C soils (e.g., cold and arid grasslands). Microbial diversity peaked in grasslands (many in cold and arid regions) with intermediate biomass, whereas biomass was particularly high in tropical forests while diversity was relatively low compared to that biomass.
- While soil pH is an essential driver of microbial richness, SOC exerts greater control over the richness-to-biomass ratio than other tested variables (pH, texture, climate) in SEM.
Discussion
Findings substantiate a global humped-back association between soil microbial diversity and biomass, reconcilable with two plant-ecology-derived mechanisms. In stressful, low-C environments, facilitation and niche differentiation likely promote coexistence, elevating diversity relative to biomass (higher diversity-to-biomass ratios). In resource-rich, high-C environments, increased microbial biomass may intensify competitive exclusion, reducing diversity relative to biomass and lowering the ratio. SOC emerges as a primary integrator of these dynamics, exerting stronger influence on biomass than on richness and thereby shaping the ratio. Given that broad functions like decomposition and respiration generally scale with biomass, shifts in SOC due to land-use intensification or climate change could reconfigure the diversity–biomass balance, with implications for ecosystem functioning. Although other factors (e.g., pH, texture, vegetation) contribute to richness patterns, SEM highlights SOC as the dominant regulator of the richness-to-biomass ratio across biomes, emphasizing the central role of carbon in structuring belowground communities and their potential functional outputs.
Conclusion
This global survey reveals a unimodal relationship between soil microbial diversity and biomass and identifies soil carbon content as a key driver of this relationship and of the standardized diversity-to-biomass ratio. The ratio peaks in arid, low-C environments and is lowest in C-rich cold or tropical systems, reflecting the stronger response of biomass than richness to SOC. These insights imply that projected declines or alterations in SOC under global change may substantially shift the diversity–biomass balance with consequences for broad soil processes. Future research should: (1) perform manipulative experiments to establish causal mechanisms (facilitation vs. competitive exclusion) across SOC gradients; (2) validate and refine global maps with independent datasets; (3) improve microbial biomass proxies, particularly for fungi, and integrate functional biomarkers; (4) directly link diversity-to-biomass ratios to multiple soil functions (respiration, enzyme activities, nutrient cycling) across biomes; and (5) incorporate additional globally mapped covariates as they become available to enhance predictive models.
Limitations
The study is observational, limiting causal inference regarding SOC effects on diversity and biomass. The fungal PLFA marker (18:2ω6) lacks perfect specificity and may include non-fungal sources, potentially biasing fungal biomass estimates. Sequencing-based diversity relies on rarefaction; although sensitivity tests showed robustness, absolute richness estimates can be influenced by depth and primer choice. Global mapping was constrained by available covariates (SOC, pH, texture, MAT, MAP, vegetation) and lacked independent cross-validation due to the absence of global datasets with both diversity and biomass. Differences between PLFA-derived and microbial biomass C estimates complicate cross-study comparisons. Some variables exhibited non-normality, requiring bootstrap-based SEM inference. Potential confounding from unmeasured factors (e.g., microhabitat structure, substrate quality) cannot be excluded.
Related Publications
Explore these studies to deepen your understanding of the subject.