Medicine and Health
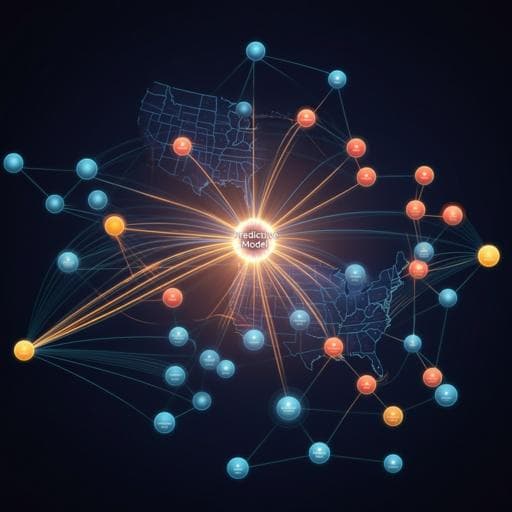
Prediction of COVID-19 Social Distancing Adherence (SoDA) on the United States county-level
M. Ingram, A. Zahabian, et al.
This enlightening study by Myles Ingram, Ashley Zahabian, and Chin Hur delves into the fascinating relationship between demographic factors and social distancing adherence across US counties. With a robust prediction model achieving 90.8% accuracy, their findings shed light on how economic, health, and political elements influence social behavior, offering crucial insights for health policy and interventions.
~3 min • Beginner • English
Introduction
The study investigates which county-level demographic, socioeconomic, health, and COVID-19–related factors correlate with and can predict social distancing adherence (SoDA) in the United States during the early COVID-19 pandemic. Given the central role of social distancing in mitigating transmission—especially prior to widespread vaccine impact—the authors aim to develop an accurate prediction tool to identify communities with lower adherence to inform resource allocation and policy interventions. The introduction contextualizes prior uncertainty about vaccine effects on transmission, outlines social distancing guidelines, and motivates the need to prioritize populations at higher risk of low adherence to improve health system preparedness and public health responses.
Literature Review
Prior work using mobile phone data has shown associations between political affiliation and socioeconomic factors with social distancing adherence: Republican-leaning counties exhibited lower adherence than Democratic counties; lower per capita income and higher proportions of racial minorities were associated with reduced adherence. Other modeling efforts (social network-based and event risk assessments) addressed distancing behaviors and infection risk but did not integrate socioeconomic predictors. Earlier mobile phone–based adherence measures did not incorporate inter-device proximity (human encounters) as a metric, which this study includes via Unacast’s encounter rate metric.
Methodology
Design and modeling: A multivariable bagging regression (bootstrap aggregating) approach was developed to predict county-level SoDA using 45 predictor features. In each bootstrap sample, data were split 80%/20% into training/test subsets, and models from each sample were aggregated. Univariable linear regressions were first run for each feature against SoDA to obtain beta coefficients for ranking feature importance. Two additional models were built: (1) a model using only COVID-19-related features (cumulative cases, cumulative deaths, days since state stay-at-home order, days since first county case, days since first county death), and (2) a model restricted to the 25 most substantial features (by beta magnitude and significance) to assess performance with reduced dimensionality.
Outcome (SoDA): Social distancing adherence was derived from Unacast mobile phone movement/location data. Unacast computes a daily social distancing score per county from three metrics relative to pre-COVID baselines (Feb 9–Mar 8, 2020): (1) percent change in average distance traveled; (2) percent change in visits to non-essential points of interest; (3) relative rate of close human encounters per square kilometer (≤50 m spatial and ≤60 min temporal co-location), normalized by land area and national pre-COVID averages. Each metric is graded 1–5; the daily SoDA score is the average of the three metrics. County assignment is based on the device’s longest location duration per day. For this study, county SoDA was the mean of daily scores from March 16, 2020 (first national stay-at-home day) to April 24, 2020 (first relaxation of guidelines), across 3054 counties with sufficient data.
Predictors and data sources: Health indicators (e.g., obesity, diabetes rates) and COVID-19 case/death counts were from CDC. 2016 presidential election voting data were from the MIT Election Data and Science Lab. Days since state stay-at-home orders were compiled from CNN reports. Demographic and socioeconomic variables were from the American Community Survey (ACS) 5-year estimates (2014–2018). The analysis used the most recent available values for all predictors.
Statistical analysis and implementation: Univariable regressions (two-tailed, alpha = 0.05) were performed with n = 3054 counties to estimate beta coefficients and p-values. Model evaluation used mean squared error and coefficient of determination (R^2), along with accuracy reported for train/test splits. Algorithms were implemented in Python using scikit-learn. Code and data are available via the linked GitHub repository.
Key Findings
- Feature correlations: Owner-occupied housing unit rate was the strongest negative correlate of SoDA (β = −0.322, p < 0.00001). Persons working from home prior to the pandemic was the strongest positive correlate (β = 0.259, p < 0.00001). Age-related variables were positively associated with adherence, including percent 65+ (β = 0.221, p < 0.00001) and median age (β = 0.204, p < 0.00001). Days since first county COVID-19 case (β = −0.276, p < 0.00001) and days since first COVID-19 death (β = −0.202, p < 0.00001) were negatively associated with adherence. Economic and commuting-related factors showed strong negative associations, including percent using vehicles to commute (β = −0.273, p < 0.00001), unemployment rate (β = −0.067, p < 0.00001), and mean travel time to work (β = −0.124, p < 0.00001), while per capita income was positively associated (β ≈ 0.028, p ≈ 0.028). Political and racial composition were significant: votes for the Republican 2016 presidential candidate (β = −0.137, p < 0.00001) and percent Black/African American (β = −0.134, p < 0.00001) correlated negatively with SoDA. Obesity (β = −0.125, p < 0.00001) and diabetes (β = −0.165, p < 0.00001) rates were negatively associated. Cumulative COVID-19 deaths (β = 0.012, p = 0.328) and cases (β = 0.008, p = 0.552) were not significant.
- Model performance: Base SoDA model achieved 91.6% accuracy overall, with training accuracy 91.4%, test accuracy 92.3%, and R^2 = 0.830. The COVID-19–only features model achieved 64.0% accuracy (train 64.1%, test 63.9%, R^2 = 0.274). The top-25-features model achieved 89.0% accuracy (train 88.7%, test 89.9%, R^2 = 0.777).
Discussion
Findings indicate socioeconomic, demographic, health, and political factors substantially influence county-level social distancing adherence. Lower adherence was associated with indicators characteristic of suburban/vehicle-dependent commuting and economic disadvantage (e.g., higher vehicle commuting, poverty, unemployment), while higher per capita income and prior work-from-home capability facilitated adherence. Health risk factors displayed mixed patterns: despite heightened COVID-19 risk, higher obesity and diabetes rates were linked to lower adherence, potentially increasing hospitalization and mortality in those communities. Older populations (higher median age and percent 65+) showed higher adherence, consistent with greater perceived risk. Counties with earlier first cases/deaths exhibited declining adherence over time, possibly reflecting risk perception dynamics. Political and racial composition were also salient: higher Republican voting share and higher proportion of Black/African American residents correlated with lower adherence, aligning with prior reports and highlighting structural and contextual barriers (e.g., overcrowding, economic constraints, misinformation). COVID-19 case and death totals alone contributed little predictive power relative to the broader socioeconomic-demographic set, underscoring the importance of multidimensional data for policy planning. The predictive model can support targeted interventions, resource allocation, and potentially inform time-sensitive measures (e.g., weekend-specific guidelines) and integration with network or risk assessment models.
Conclusion
The study demonstrates that county-level adherence to social distancing can be accurately predicted using a combination of demographic, socioeconomic, health, political, and timing-related features. Strong correlates include owner-occupied housing rate (negative), prior work-from-home prevalence (positive), age structure (older populations positive), vehicle commuting (negative), economic indicators (per capita income positive; poverty/unemployment negative), timing since first case/death (negative), political affiliation (Republican vote share negative), and racial composition (Black/African American share negative). The bagging regression model achieved high accuracy, and a reduced top-25-features model performed comparably, while COVID-19–only features were insufficient. These insights can guide health policy planning and interventions for communities at risk of lower adherence. Future research should explore causal mechanisms, temporal (daily) adherence dynamics, and model extensions incorporating additional behavioral and contextual data.
Limitations
- Behavioral nuances like mask and glove usage are not captured by the proximity-based encounter metric.
- Mobile phone data exclude non-phone users and may not fully represent all subpopulations.
- Averaging SoDA over the study window may mask day-to-day patterns; daily modeling could yield different insights.
- Some demographic inputs come from ACS 2014–2018 estimates and may not reflect current county characteristics during 2020.
- Counties with insufficient mobile data were excluded, potentially introducing selection bias.
Related Publications
Explore these studies to deepen your understanding of the subject.

