Health and Fitness
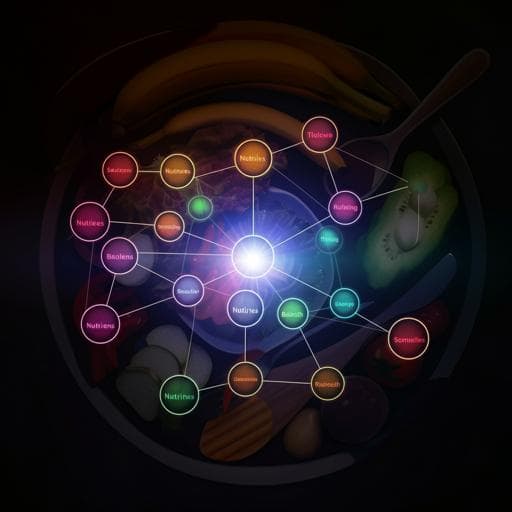
Nutritional redundancy in the human diet and its application in phenotype association studies
X. Wang, Y. Hu, et al.
This groundbreaking research examines 'nutritional redundancy,' revealing how diverse individual diets can contribute to stable overall nutrient intake. By introducing a novel measure of nutritional redundancy and linking it to healthier outcomes, the authors illuminate a path toward better understanding healthy aging and disease risk. Conducted by Xu-Wen Wang, Yang Hu, and colleagues, this study is a must-listen for anyone interested in nutrition and health.
~3 min • Beginner • English
Introduction
The study investigates how variability in human food choices contrasts with relative stability in nutrient intake profiles across individuals and time. Despite large differences in dietary patterns (e.g., Mediterranean vs Western diets), underlying nutrient compositions may be similar. The authors formalize this as nutritional redundancy (NR): the observation that nutrient profiles are conserved while food profiles are personalized and dynamic. They hypothesize that NR arises from structural properties of the food-nutrient network (FNN) and that an individual-level NR metric can be defined and linked to health-related phenotypes. The goals are to: (1) demonstrate population-level NR across multiple cohorts and timescales, (2) quantify personal NR from diet records using an FNN, (3) compare NR to established healthy diet scores and host factors, and (4) examine associations between NR and healthy aging, type 2 diabetes, and cardiovascular disease.
Literature Review
The work builds on evidence that diet affects chronic diseases including obesity, type 2 diabetes, and cardiovascular disease, with randomized trials supporting benefits of Mediterranean and DASH diets. Nutrient profiling underpins dietary guidance and labeling and relies on databases such as USDA FNDDS, Frida, and FooDB. The authors relate NR to functional redundancy in microbiome research, where taxonomic variability coexists with conserved functional profiles. Prior food composition network studies have shown clustering by animal- vs plant-based foods. The study leverages and extends these concepts by focusing on the topology (nestedness) of the bipartite food-nutrient network to explain NR and its health relevance.
Methodology
Datasets and participants: Five cohorts with dietary data at different timescales were analyzed. (1) DMAS: 34 healthy adults with daily ASA24 diet records over 17 days; two outliers (“shake drinkers”) removed; n=30 with complete data; 41 nutrients, 9 food groups. (2) NHS: female nurses enrolled in 1976; semi-quantitative FFQs every ~4 years; eight time points available; n=35,256 with complete data. (3) HPFS: male health professionals followed since 1986; seven FFQ time points; n=17,529 with complete data. (4) WLVS (NHS/NHSII substudy): up to four ASA24 records within 1 year; n=216 with four records. (5) MLVS (HPFS substudy): up to four ASA24 records within 1 year; n=451 with four records.
Data processing: Food profiles were relative abundances of food items/groups; nutrient profiles computed by converting nutrients to grams and normalizing by total nutrient grams. Beta diversity between individuals was quantified using Bray-Curtis, root Jensen-Shannon divergence, Yue-Clayton distance, and negative Spearman correlation at both food and food-group levels.
Food-nutrient network (FNN): A weighted bipartite network connecting foods (N nodes) and nutrients (M nodes), represented by incidence matrix G where G_ia is the amount of nutrient a contributed by food i. Nutrient profile n is computed from food profile f as n = c f G, with normalization constant c.
Reference FNNs: Constructed from USDA FNDDS 2011–2012 (7618 foods, 65 nutrients) and Harvard Food Composition Database (HFDB) for NHS/HPFS. Visualization and analysis included the incidence matrix, nutritional distance distribution (Jaccard-based), and degree distributions of foods (number of nutrients per food) and nutrients (number of foods containing a nutrient). Nestedness was quantified using the NODF metric and compared against randomized ensembles preserving degree sequences.
Definition of nutritional redundancy (NR): Personal NR for a diet assessment is defined as NR = FD − ND, where FD (food diversity) is the Gini-Simpson index (probability that two randomly chosen units fall into different food groups) and ND (nutritional diversity) is Rao’s quadratic entropy Q using pairwise nutritional distances d_ij between foods, computed as unweighted Jaccard distances between their sets of nutrients. Thus, NR reflects the expected nutrient overlap of two randomly chosen food items in the assessed diet.
Null models: To assess the role of FNN topology on NR, four FNN randomizations were used: (Null-FNN-1) complete rewire preserving N and M; (Null-FNN-2) preserve food degrees; (Null-FNN-3) preserve nutrient degrees; (Null-FNN-4) preserve both food and nutrient degrees while rewiring links. To assess food composition effects, three null models were used: (Null-comp-1) random food assemblages drawn from the pool keeping the same number of foods and composition proportions; (Null-comp-2) permute non-zero food abundances within each participant across foods; (Null-comp-3) permute non-zero abundances for each food across participants.
Healthy aging prediction: A subset of NHS (n=21,299) with defined healthy agers (n=3,491) vs usual agers (n=17,808) was used. Features from 1998 included personal NR or one healthy diet score (HEI-2005, AHEI-2010, AMED, DASH) plus host factors (age, education, marital status, income, BMI, energy intake, multivitamin use, aspirin use, smoking pack-years, physical activity). Random forest classifiers (80/20 train/test split, 200 repetitions) assessed error rate and AUROC; robustness tested with Hill number-based NR and XGBoost. HPFS substudy with 6,160 healthy agers and 11,534 usual agers provided replication.
Disease association analyses: Cox proportional hazards models stratified by age (months) and calendar year assessed associations between tertiles (and quintiles) of NR and incident type 2 diabetes (T2D) and cardiovascular disease (CVD) in NHS (1984–2014) and HPFS (1986–2016). Models adjusted first for age only, then multivariable adjustments: ethnicity, BMI categories, smoking status, alcohol intake, hypertension, hypercholesterolemia, multivitamin use, physical activity, Alternative Healthy Eating Index, family history (of diabetes for T2D; myocardial infarction for CVD); in NHS additionally postmenopausal hormone use and oral contraceptive use. Food group consumption patterns across NR tertiles were examined to contextualize associations.
Key Findings
- Population-level NR: Food profiles are highly dynamic and personalized across daily, monthly, and multi-year timescales, whereas nutrient profiles are highly conserved and not highly personalized across individuals. Nutritional beta diversity is significantly lower than food beta diversity across all cohorts and measures.
- FNN structure: The reference FNN (FNDDS: 7618 foods, 65 nutrients) shows a highly nested incidence matrix (high NODF), unimodal nutritional distance distribution peaking ~0.25 (most foods share similar nutrients), Poisson-like food degree distribution (similar number of nutrients per food), and nutrient degrees concentrated at high values (most nutrients present in many foods). Nestedness remains high after excluding high-degree macronutrients and non-specific nutrients; randomized FNNs preserving degree sequences show significantly lower nestedness and higher mean d.
- Personal NR magnitude: Across DMAS, WLVS, MLVS, NHS, and HPFS, median NR ≈ 0.3, indicating comparable magnitudes of nutrient diversity and redundancy in human diets.
- Null model results: All four FNN randomization schemes produce substantially lower NR than the real FNN, implicating real network topology (nestedness and low mean nutritional distance) as key determinants of NR. Composition null models show that random assemblages (Null-comp-1) increase NR for ASA24 studies and are comparable for NHS/HPFS; permutation across participants (Null-comp-3) does not significantly alter NR, suggesting consistent assembly rules across individuals.
- Correlation with healthy diet scores and host factors: NR shows weak correlations with diet scores—positive with AMED (ρ=0.12) and DASH (ρ=0.08), negative with HEI (ρ=−0.16) and AHEI (ρ=−0.08)—and weak correlations with host factors (negative with BMI and smoking pack-years; positive with education, income, energy intake, physical activity).
- Healthy aging prediction: In NHS, personal NR achieves error rates and AUROC comparable to HEI-2005, AHEI-2010, AMED, and DASH for predicting healthy aging status (1998 features predicting 2012 status), and similar findings replicated in HPFS. Performance robustness holds with Hill number-based NR and XGBoost.
- Disease associations:
• Type 2 diabetes: NHS age-adjusted HRs for tertiles T2 and T3 vs T1: 0.86 (0.80–0.93) and 0.78 (0.72–0.85), P-trend <0.001; multivariable-adjusted: 0.93 (0.86–1.01) and 0.93 (0.85–1.00), P-trend=0.0997. HPFS age-adjusted: 0.73 (0.65–0.82) and 0.73 (0.65–0.82), P-trend <0.001; multivariable-adjusted: 0.77 (0.69–0.87) and 0.82 (0.73–0.93), P-trend=0.0016.
• Cardiovascular disease: NHS age-adjusted HRs: 0.92 (0.85–0.99) and 0.85 (0.79–0.92), P-trend <0.001; multivariable-adjusted: 0.94 (0.87–1.02) and 0.90 (0.83–0.97), P-trend=0.0057. HPFS age-adjusted: 0.94 (0.87–1.02) and 0.89 (0.83–0.96), P-trend=0.0041; multivariable-adjusted: 0.97 (0.89–1.04) and 0.92 (0.85–1.00), P-trend=0.0405. Results are similar with NR quintiles.
- Dietary patterns by NR tertile: High-NR participants (T3) consume more fruits, vegetables, dairy/egg products, and cereal grains, and fewer beverages, in both NHS and HPFS. Food diversity alone (FD) is not associated with lower T2D or CVD risk after multivariable adjustment, indicating NR contributes beyond FD.
Discussion
The study addresses whether nutrient profiles remain stable despite diverse and personalized food choices and whether this stability can be quantified and related to health. Findings confirm pronounced divergence of food intake across individuals and time, contrasted with conserved nutrient intake profiles—captured by nutritional redundancy (NR). The FNN’s highly nested topology explains why many different food combinations yield similar nutrient spectra, creating redundancy. Personal NR, though weakly correlated with classical diet quality scores, predicts healthy aging comparably and shows inverse associations with type 2 diabetes and cardiovascular disease risks after age adjustment (and persisting after multivariable adjustment in several analyses). These associations may reflect that higher NR corresponds to dietary patterns richer in fruits, vegetables, and grains and lower in sugary beverages, though NR is conceptually distinct from diet quality. The work suggests NR is a complementary lens to diet scores, potentially enabling NR-aware diet evaluation by examining redundancy within food groups or score components. Network-based insights into food composition provide a structural basis for understanding how diverse diets can converge on similar nutrient intakes and how that redundancy relates to health.
Conclusion
This work introduces nutritional redundancy (NR) as a quantifiable property of human diets: the component of food diversity not reflected in nutrient diversity. Using large cohorts and multiple timescales, the authors show nutrient profiles are conserved across individuals while food profiles are personalized. They construct and analyze a food-nutrient network with strong nestedness explaining NR’s emergence, and define a personal NR metric that predicts healthy aging comparably to established diet scores and is inversely associated with risks of type 2 diabetes and cardiovascular disease. NR is largely independent of conventional diet quality indices and thus provides a new perspective for nutrition science. Future work should integrate NR with diet quality metrics, incorporate more granular nutrient chemistry and amounts, leverage objective nutritional biomarkers, extend null model exploration, and validate causal effects via interventional studies.
Limitations
- Nutrient amount scaling: The NR calculation used unweighted Jaccard distances for nutrients to avoid dominance by large magnitude differences; alternative scaling and nutrient selections could affect ND and NR.
- Self-reported diet: ASA24 and FFQ data are subject to recall and reporting biases; biomarker-based assessments could provide more objective evaluation but were beyond scope.
- Incomplete nutrient databases: Current databases capture a small subset of the vast chemical diversity of foods, potentially underestimating or biasing NR; more comprehensive databases may strengthen NR’s utility.
- Null model scope: Although multiple FNN null models were tested, other network characteristics besides nestedness might explain observed NR; broader model exploration is needed.
- Nutrient ontology and correlations: Overlapping or correlated nutrients (e.g., fatty acids, amino acids) may bias distance metrics; while analyses excluding broad nutrient families showed robustness, systematic ontology impacts need further study.
Related Publications
Explore these studies to deepen your understanding of the subject.

