Economics
Nonlinear El Niño impacts on the global economy under climate change
Y. Liu, W. Cai, et al.
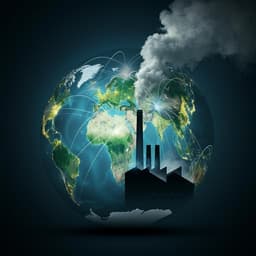
This research by Yi Liu, Wenju Cai, Xiaopei Lin, Ziguang Li, and Ying Zhang uncovers the substantial economic damage caused by El Niño events, revealing that the impacts can last up to three years and cost trillions of dollars, especially as climate change intensifies ENSO variability. Discover how La Niña's effects differ and what this means for the future under high-emission scenarios.
~3 min • Beginner • English
Introduction
The El Niño–Southern Oscillation (ENSO) alternates between the warm phase El Niño and cool phase La Niña, modulating tropical Pacific sea surface temperatures, trade winds, and deep convection, and teleconnecting to global atmospheric circulation. These climate anomalies affect extreme weather, hydrological cycles, ecosystems, agriculture, and human communities worldwide. Historically, major ENSO events have produced substantial economic impacts via floods, droughts, wildfires, and other extremes, with direct losses recorded in many regions. While ENSO’s links to subcomponents of economic production (e.g., crop yields, fisheries) are well established and micro-level losses can aggregate to macroeconomic outcomes, El Niño and La Niña effects are not symmetric and do not simply offset. Under climate change, temperature and precipitation means have been common impact metrics, but recent advances suggest ENSO variability is likely to increase under greenhouse warming. Whether such changes intensify macroeconomic risks is a critical open question. Here, using historical climate and economic data, the study assesses ENSO’s impact on global economic production, testing for nonlinear and lagged effects and projecting how future changes in ENSO variability may alter global economic outcomes under warming.
Literature Review
Past econometric studies often treated ENSO linearly, focusing on El Niño’s negative impact and assuming symmetric opposite effects for La Niña. Limited nonlinear approaches using step functions showed La Niña does not consistently confer benefits and can cause damaging extremes (e.g., flooding). Physical climate studies show ENSO is a nonlinear dynamical system with asymmetric amplitudes and teleconnections; El Niño amplitudes and global impacts tend to exceed those of La Niña. Prior impact estimates for extreme El Niño events were typically in the tens of billions of US dollars, focusing on direct, tangible losses. Broader climate-economy literature documents nonlinear impacts of temperature and precipitation on growth. Recent climate projections (CMIP6) indicate ENSO SST variability is likely to increase across SSP scenarios. A contemporaneous independent study (2023) using a linear model also investigated persistent economic effects of El Niño, but assumed symmetric ENSO impacts, leading to different uncertainty attributions.
Methodology
The study builds a fixed-effects panel econometric model with distributed lags to estimate ENSO’s nonlinear, multi-year effects on country-level GDP per capita growth over 1960–2019. Key features: (1) ENSO index: DJF Niño3.4 SST anomaly (5°S–5°N, 120°–170°W), normalized, using D(0)JF(1) at ENSO peak. (2) Controls: country fixed effects; country-specific linear and quadratic time trends; nonlinear controls for annual mean temperature and precipitation with ENSO signals removed via linear regression to obtain ENSO-independent annual temperature and precipitation. (3) Nonlinearity and lags: ENSO enters as quadratic function with contemporaneous and lagged terms; optimal lag length determined via tests shows effects persist up to 3 years, after which impacts diminish and uncertainty increases, so a 3-year lag is used. (4) Estimation: OLS on first difference of log GDP per capita (growth), with interactions allowed for time-invariant and time-trending covariates. Bootstrap methods (country, year, 5-year block resampling) quantify uncertainty and provide 95% confidence intervals; sensitivity tests include running-window estimations and random year omissions. (5) Teleconnection and heterogeneity: Country-specific ENSO teleconnections are derived by regressing monthly gridded temperature and precipitation anomalies onto DJF Niño3.4 from May(0) to April(1), accumulating statistically significant coefficients, then aggregating to population-weighted country metrics for temperature and precipitation to yield a total teleconnection strength ψ. Countries are grouped by teleconnection strength, agricultural dependence, and income level to test heterogeneous responses, and interactions of ENSO with country-specific teleconnection are evaluated. (6) Historical data: Observational SSTs (HadISST; robustness via ERSSTv5), reanalysis, country-level GDP per capita (World Bank WDI; robustness via Penn World Tables), and population density (GPWv4). (7) Future projections: CMIP6 model outputs under SSP1-2.6, SSP2-4.5, SSP3-7.0, SSP5-8.5 are used to compute changes in Niño3.4 variability (standard deviation) for 2000–2099 relative to 1900–1999, after constructing anomalies and quadratic detrending. (8) Counterfactual ENSO: To isolate the effect of increased ENSO amplitude, a counterfactual 21st-century Niño3.4 time series is constructed by rescaling the projected ENSO sequence to match 20th-century standard deviation, preserving event sequence while removing amplitude changes. (9) Economic loss calculation: Annual ENSO-induced changes in GDP per capita growth are derived from the estimated response function including contemporaneous and lagged ENSO terms. Global loss values are computed by applying growth changes to prior-year GDP, cumulated over years and lags. For the future, two "no-ENSO" counterfactual GDP paths (removing projected and counterfactual ENSO effects) are constructed from SSP socioeconomic projections (2010–2099). The difference between projected-ENSO and counterfactual-ENSO losses yields the additional loss attributable to increased ENSO amplitude. (10) Discounting: Cumulative losses over 2020–2099 are discounted at fixed annual rates (1–5%); a 3% rate is emphasized. (11) Uncertainty assessment: Uncertainty sources are decomposed—SSP scenario, climate model differences in ENSO amplitude change, discount rate, historical regression uncertainty, and ENSO event sequence—by varying one factor at a time while holding others fixed, and by allowing all to vary for total uncertainty. ENSO sequences are bootstrapped (10,000 permutations with same amplitude) to assess sequence sensitivity.
Key Findings
• ENSO impacts on macroeconomic growth are nonlinear and asymmetric: El Niño causes significant, multi-year global economic losses, while La Niña benefits are weak and often offset by negative growth effects. Impacts persist and grow for approximately 3 years following El Niño.
• Historical losses from extreme El Niño events are an order of magnitude larger than prior tangible-loss estimates. Estimated cumulative global losses (occurrence year plus next 3 years): 1982–83 El Niño ~US$1.3 trillion; 1997–98 El Niño ~US$2.1 trillion; 2015–16 El Niño ~US$3.9 trillion. Contemporaneous losses alone were US$246B, US$401B, and US$739B, respectively (~0.9–1.0% of global GDP at the time), with growth (lagged) effects dominating total losses.
• Extreme La Niña events yield net effects fluctuating around zero; for 1998–99 La Niña, cumulative gain is only ~US$0.06 trillion.
• Over 1960–2019, ENSO cycles reduced global GDP growth by an average of ~0.6% per year, summing to about US$13.5 trillion in cumulative global economic production loss. Three extreme El Niño events (1982–83, 1997–98, 2015–16) account for 54% of this total.
• Heterogeneity: Teleconnected, agriculture-dependent, and lower-income countries exhibit stronger negative responses to El Niño, though global spillovers mean a common shock dominates. Interaction terms with country-specific teleconnections are generally not statistically significant at the global level.
• Future ENSO variability increases across CMIP6 under all SSPs: median Niño3.4 variability increases of ~14.3% (SSP5-8.5), 13.1% (SSP3-7.0), 9.5% (SSP2-4.5), 7.5% (SSP1-2.6). Models with larger ENSO amplitude increases produce larger reductions in century-averaged global GDP growth.
• Century-average reductions in annual global GDP growth due to ENSO (projected vs counterfactual) increase with emissions: multi-model median (mean) reductions of ~0.19% (0.25%) for SSP5-8.5, 0.18% (0.23%) for SSP3-7.0, 0.12% (0.19%) for SSP2-4.5, and 0.10% (0.17%) for SSP1-2.6.
• Additional ENSO-induced economic loss (2020–2099, 3% discount rate) attributable to increased ENSO amplitude has >80% probability under all SSPs; median additional loss is ~US$33T (SSP5-8.5) and ~US$14T (SSP2-4.5). Under SSP1-2.6, additional loss is reduced by ~50% relative to SSP5-8.5. Nonlinear scaling implies possible additional losses up to ~US$374T in high-emission scenarios.
• Uncertainty decomposition shows climate model differences in ENSO amplitude change dominate total uncertainty; econometric regression and ENSO sequence contribute relatively little.
Discussion
By explicitly modeling ENSO’s nonlinear and lagged macroeconomic impacts, the study shows that El Niño’s damages are both larger and more persistent than previously recognized, while La Niña’s benefits are weak and often offset by negative growth effects. This asymmetry leads to a net reduction in global GDP growth across ENSO cycles. The results reconcile observed micro-level impacts (e.g., on agriculture, fisheries, infrastructure, energy, health, and tourism) with macroeconomic outcomes via spillover and cascading channels that propagate and amplify initial shocks across sectors and borders. Under climate change, projected increases in ENSO amplitude systematically translate into larger global growth reductions and substantial additional discounted economic losses through the century, with strong intermodel relationships linking SST variability increases to macroeconomic damages. Mitigation consistent with SSP1-2.6 can halve additional ENSO-related losses, underscoring the macroeconomic benefits of limiting warming. The findings address the core questions regarding magnitude, persistence, and future evolution of ENSO’s macroeconomic impacts and emphasize the policy relevance of accounting for ENSO variability changes in climate risk assessments and mitigation cost–benefit analyses.
Conclusion
ENSO exerts a nonlinear, asymmetric, and multi-year drag on the global economy, with El Niño events causing large, persistent losses that dominate any modest La Niña gains. Historically, ENSO cycles reduced average global GDP growth and produced multi-trillion-dollar losses for extreme El Niño events. Looking forward, widespread increases in ENSO variability across emission scenarios are projected to further depress growth and add substantial cumulative economic losses, potentially in the tens of trillions of US dollars, and in extreme cases much higher, with mitigation halving these additional losses under a 1.5–2 °C pathway. These results call for integrating ENSO variability changes into climate–economy assessments, adaptation planning, and mitigation strategy evaluation. Future research should refine projections of ENSO amplitude and teleconnections, integrate additional impact pathways (e.g., sea-level rise via ocean and cryosphere responses), explore adaptive capacity and sectoral dynamics, and further investigate distributional impacts and resilience policies, especially in teleconnected, agriculture-dependent, and lower-income economies.
Limitations
Key limitations and uncertainties include: (1) Dependence on climate model projections of future ENSO amplitude; inter-model spread in ENSO variability change is the largest uncertainty source. (2) Econometric identification assumes the ENSO-removed mean temperature and precipitation controls adequately separate mean climate effects from ENSO variability; residual dependence could bias estimates. (3) The model assumes ENSO’s impact persists up to 3 years and imprints permanently on long-term economic trajectories in future projections, which may overstate or understate persistence depending on adaptive responses. (4) Not all transmission pathways are included—e.g., effects mediated through ocean warming, ice shelf/sheet melt, and sea-level rise likely add further damages. (5) Potential data limitations and measurement error in historical economic and climate datasets, and structural differences across countries. (6) Despite testing heterogeneity, a common global shock dominates; localized sector-specific dynamics and policy responses may not be fully captured. (7) Discount rate choices materially affect present-value loss estimates.
Related Publications
Explore these studies to deepen your understanding of the subject.

