
Earth Sciencesnpj | biodiversity
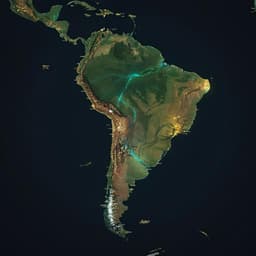
Niche-dependent forest and savanna fragmentation in Tropical South America during the Last Glacial Maximum
D. I. Kelley, H. Sato, et al.
This groundbreaking research by Douglas I. Kelley and colleagues uncovers the fragmented landscapes of the Amazon during the Last Glacial Maximum, challenging established theories on biodiversity and refugia. Discover how drier ecosystems might have shaped a unique corridor for species diversification while connecting isolated forest fragments.
Related Publications
Explore these studies to deepen your understanding
Adjacent work that informs or extends this paper's methodology and findings.

Earth Sciences
Combined large-scale tropical and subtropical forcing on the severe 2019–2022 drought in South America
J. L. Geirinhas, A. C. Russo, et al.
Social Work
Resolution and the detection of cultural dispersals: development and application of spatiotemporal methods in Lowland South America
P. Riris and F. Silva

Earth Sciences
Exceptional warmth and climate instability occurred in the European Alps during the Last Interglacial period
P. S. Wilcox, C. Honiat, et al.
Earth Sciences
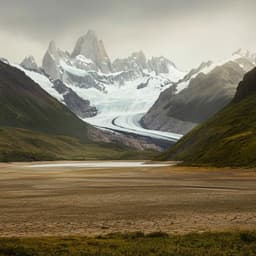
Andean drought and glacial retreat tied to Greenland warming during the last glacial period
A. Woods, D. T. Rodbell, et al.


