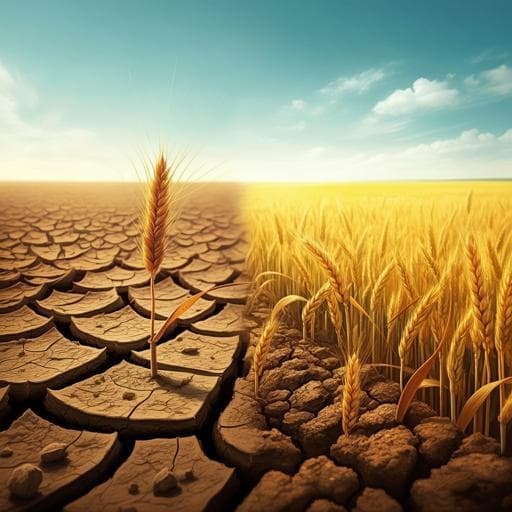
Multi-annual prediction of drought and heat stress to support decision making in the wheat sector
B. Solaraju-murali, N. Gonzalez-reviriego, et al.
Explore these studies to deepen your understanding
Adjacent work that informs or extends this paper's methodology and findings.
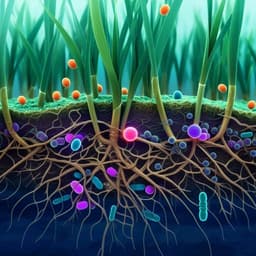
The response of wheat and its microbiome to contemporary and historical water stress in a field experiment
H. Azarbad, L. D. Bainard, et al.

Efficacy of early PET-CT directed switch to carboplatin and paclitaxel based definitive chemoradiotherapy in patients with oesophageal cancer who have a poor early response to induction cisplatin and capecitabine in the UK: a multi-centre randomised controlled phase II trial
S. Mukherjee, C. N. Hurt, et al.

Trapped in the prison of the mind: Notions of climate-induced (im)mobility decision-making and wellbeing from an urban informal settlement in Bangladesh
S. Ayeb-karlsson, D. Kniveton, et al.

A "pre-traumatic stress syndrome": trauma and war in Elizabeth Bowen's *The Last September* and *The Heat of the Day*
Q. He


