
Improved seasonal prediction of harmful algal blooms in Lake Erie using large-scale climate indices
M. Tewari, C. M. Kishtawal, et al.
Explore these studies to deepen your understanding
Adjacent work that informs or extends this paper's methodology and findings.

Combined Earth observations reveal the sequence of conditions leading to a large algal bloom in Lake Geneva
A. I. Rahaghi, D. Odermatt, et al.
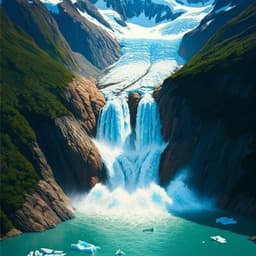
Abrupt drainage of Lago Greve, a large proglacial lake in Chilean Patagonia, observed by satellite in 2020
S. Hata, S. Sugiyama, et al.
Design and Analysis of a Deep Learning Ensemble Framework Model for the Detection of COVID-19 and Pneumonia Using Large-Scale CT Scan and X-ray Image Datasets
X. Xue, S. Chinnaperumal, et al.

Development of prediction models for screening depression and anxiety using smartphone and wearable-based digital phenotyping: protocol for the Smartphone and Wearable Assessment for Real-Time Screening of Depression and Anxiety (SWARTS-DA) observational study in Korea
Y. Shin, A. Y. Kim, et al.


