
Engineering and Technology
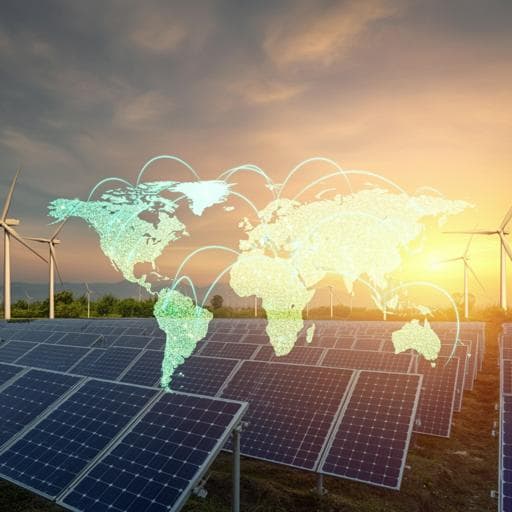
Global land and water limits to electrolytic hydrogen production using wind and solar resources
D. Tonelli, L. Rosa, et al.
This research, conducted by Davide Tonelli, Lorenzo Rosa, Paolo Gabrielli, Ken Caldeira, Alessandro Parente, and Francesco Contino, assesses the global potential for large-scale electrolytic hydrogen production through wind and solar energy. It highlights which countries may struggle with local resource scarcity and identifies regions poised to become hydrogen exporters by 2050.
~3 min • Beginner • English
Introduction
The study investigates whether countries can meet prospective electrolytic hydrogen demand by 2050 using domestic wind and solar resources without breaching land and water sustainability limits. Motivated by net-zero targets and the need to decarbonize hydrogen production currently dominated by fossil feedstocks, the authors assess country-level constraints in land availability (considering competing uses and practical siting limits) and water availability (considering environmental flow requirements). The purpose is to identify where natural resource constraints may hinder local hydrogen self-sufficiency, and to highlight potential future importers and exporters of hydrogen or hydrogen-reliant industries. The importance lies in quantifying geophysical constraints that could shape the geopolitics and industrial geography of the hydrogen economy.
Literature Review
Prior assessments often evaluate global land and water availability for green hydrogen without country-specific constraints. Literature highlights: (i) competition for land from agriculture, biofuels, biodiversity and habitat concerns related to wind/PV siting; (ii) rising global water demand and uneven distribution, with local water scarcity already affecting multiple sectors; (iii) expectations that much electrolyzer capacity will locate in high-solar yet water-scarce regions; and (iv) geopolitical analyses predicting new dependencies through hydrogen trade from resource-abundant to resource-limited nations. Existing work provides global scenarios for hydrogen demand (3–12% of final energy by 2050) and notes supply-chain, infrastructure, and environmental limitations, but lacks a harmonized country-by-country integration of hydrogen demand by sector with spatially explicit renewable yields and explicit land and water scarcity accounting. This study builds on and extends such literature by disaggregating demand by sector and country for 2020 and 2050, integrating high-resolution geospatial power yields, and formalizing scarcity metrics.
Methodology
The analysis proceeds in five steps: (1) Hydrogen demand disaggregation: Starting from global hydrogen demand in a 2050 net-zero reference scenario (400 Mt/y; range 92–646 Mt/y), the authors disaggregate by country and sector (chemicals—ammonia and methanol, cement, refineries and light industry, steel, transport). For 2020, current hydrogen uses are re-cast as electrolytic in a counterfactual. Country-level allocations use historical final energy consumption, sectoral CO2 emissions (for cement), and non-energy use of natural gas/coal for ammonia and methanol, scaled to 2050 by projected population changes and normalized to IEA/RTS projections. Hydrogen for the power sector is excluded. (2) Electricity demand: Country electricity demand for 2020 and 2050 is estimated by scaling 2019 values with population changes and aligning to regional projections. (3) Renewable energy yield: Using a 0.75°×0.75° global grid, the study computes annual energy production per unit area for PV and onshore wind based on irradiance, capacity factor, and array efficiency. Cells in protected areas and areas with high water stress are excluded. For each country, energy yield is taken as the area-weighted mean of the top quartile of grid cells, representing likely siting in high-yield areas. (4) Land and water requirements: Land required equals country hydrogen electricity demand divided by electrolyzer efficiency and energy yield per unit area for PV or wind. Water withdrawals include the stoichiometric and treatment needs for electrolysis plus manufacturing and operational water footprints of PV, wind, and electrolyzers, expressed per unit electricity and scaled by country hydrogen demand and electrolyzer efficiency. (5) Scarcity metrics: Land eligibility accounts for technical exclusions by land cover (forests, agriculture, urban) with technology-specific eligibility coefficients, producing eligible land per country. Practical deployment is captured by a coverage fraction (f_coverage from 1–100%). Land scarcity is the ratio of land required to land practically coverable. Water availability equals renewable water resources minus environmental flow requirements (assumed 80% of WR, leaving 20% for human use). Water scarcity is withdrawals divided by availability, with and without hydrogen, to assess exacerbation. Sensitivity analyses span hydrogen demand scenarios and coverage fractions for solar or wind.
Key Findings
- Hydrogen demand growth: In the reference case, per capita hydrogen demand rises about sevenfold from 2020 to 2050 versus a twofold increase in direct electricity demand; transport and chemicals drive the increase, while refineries decline (~80%).
- Land requirements: To meet 2050 hydrogen demand, global land needs span 0.09–0.6 million km² for solar and 1.9–13.5 million km² for onshore wind (depending on global demand 92–646 Mt/y). Countries like Canada, Australia, Russia, Algeria, and Argentina could meet 2050 demand by covering roughly 1% of eligible land with solar. Wind’s lower power density causes >10× larger land footprints than solar in many cases, creating land scarcity in countries with limited land per capita (e.g., Japan, South Korea).
- Water requirements: Global water withdrawals for 2050 hydrogen range from 13.6–95.6 billion m³ for PV-based systems and 3.2–22.6 billion m³ for wind-based systems. Against global withdrawals of 3976 billion m³, hydrogen accounts for <3% and 0.13–0.56% of globally available water (10,560 billion m³). Hydrogen’s water use is typically <5% of national withdrawals and rarely creates new scarcity; Trinidad and Tobago is the major exception where hydrogen demand can dominate water withdrawals.
- Land scarcity patterns: With 100% eligible land coverage, only Trinidad and Tobago is land-scarce for solar; several countries (Belgium, Netherlands, Equatorial Guinea, Japan, South Korea, Malaysia) are land-scarce for wind. With f_coverage <10%, solar-driven scarcity emerges in additional countries (e.g., Germany, UK, Austria); wind causes scarcity in a larger set due to lower power density.
- Combined scarcity and supply potential (reference 400 Mt/y): With solar and f_coverage = 5%, 10 Mt/y (3%) of demand is in countries constrained by both land and water, 43 Mt/y (11%) by land alone, 163 Mt/y (41%) by water alone, and 184 Mt/y (46%) can be met domestically without land or water scarcity. Water scarcity is concentrated in MENA, South Africa, India, China, and parts of Central Asia. The number of countries facing both scarcities rises markedly when assuming wind-only supply (e.g., 14 countries at 10% coverage; 20 countries at 5% coverage), versus solar (3 countries at 10% coverage; 4 at 5%).
- Trade and geopolitics: Resource-abundant regions—Southern and Central-East Africa, West Africa, South America, Canada, and Australia—are potential hydrogen exporters. Western Europe, Japan, South Korea, the Dominican Republic, and Trinidad and Tobago are likely importers or may offshore hydrogen-reliant industries. Trinidad and Tobago, despite small population, has exceptionally high per-capita hydrogen demand (driven by ammonia/methanol exports), requiring about 165 TWh/y of hydrogen by 2050 and a combination of solar, onshore, and offshore wind, or low-carbon hydrogen from natural gas with CCS, to sustain industry.
- Technology-specific insights: PV generally has higher land-use efficiency but higher water footprints in manufacturing than wind; electrolysis water demand is dominated by water treatment (≈62%) and stoichiometric needs (≈38%). Desalination adds <2% to hydrogen cost and modest energy compared to electrolysis (≈0.072 vs 53.8 kWh/kg H2). Hybrid solar–wind systems can improve land utilization and reduce storage needs.
Discussion
By integrating country-level hydrogen demand and spatially explicit renewable yields with land and water availability constraints, the study shows that geophysical limits will strongly shape where green hydrogen can be produced domestically at scale. The results address the central question by quantifying that, under realistic land coverage assumptions, less than half of global 2050 hydrogen demand can be met domestically without exacerbating land or water scarcity. This identifies likely importing regions (Western Europe, Japan, South Korea, Trinidad and Tobago) and exporting regions (parts of Africa, South America, Canada, Australia), informing infrastructure planning, trade policy, and industrial location strategies. The findings emphasize that: (i) land availability and power density are dominant constraints (especially for wind-only supply), (ii) water requirements are modest at global and most national scales but can exacerbate existing scarcity in 37 countries, particularly in MENA, and (iii) desalination or nontraditional water sources can mitigate water constraints at low added cost. The analysis underscores the importance of site-specific assessments, hybrid renewable portfolios, and careful siting (including agrivoltaics/aquavoltaics, innovative wind designs) to reduce land and water pressures. These insights are relevant for planning sustainable hydrogen supply chains consistent with net-zero goals.
Conclusion
The paper provides a country-by-country assessment of the land and water implications of producing electrolytic hydrogen from solar and onshore wind by 2050. It shows that under a reference 400 Mt/y demand, and with modest land coverage assumptions, fewer than half of countries’ demands can be met domestically without triggering land and/or water scarcity, with wind presenting a much greater land challenge than solar. Regions in Southern and Central-East Africa, West Africa, South America, Canada, and Australia are well-positioned to become exporters, whereas various Western European countries, Japan, South Korea, and Trinidad and Tobago are likely importers or may need to relocate hydrogen-intensive industries. Water demand for hydrogen is globally small but can exacerbate scarcity where it already exists. Future research should: (i) incorporate additional power sources (offshore wind, nuclear, hydropower) and hybrid configurations; (ii) include hydrogen for the power sector and electrolyzer cooling water; (iii) couple geophysical constraints with techno-economic models, infrastructure and supply-chain considerations; and (iv) refine spatiotemporal siting with higher-resolution geodata and dynamic demand/land-use projections.
Limitations
- Scope limited to electrolytic hydrogen powered by PV and onshore wind; excludes offshore wind, nuclear, hydropower, and fossil-based low-carbon hydrogen in the core modeling.
- Hydrogen demand for the power sector is excluded; if included, demand could be ~25% higher.
- Land eligibility relies on country-level land-use statistics and fixed eligibility coefficients; practical socio-political constraints are abstracted into a coverage fraction and not modeled explicitly.
- Renewable yields use 0.75° grid with top-quartile site selection and exclude protected/high-stress areas; intra-country siting heterogeneity and grid constraints are not fully captured.
- Assumes manufacturing of PV, wind, and electrolyzers occurs in the same country as installation; globalized supply-chain water use is not traced.
- Water availability assumes environmental flow requirements at 80% of renewable water resources; uncertainty in hydrology and climate change impacts over time are not explicitly modeled.
- Electrolyzer cooling water is not included, which could increase water demand by ~19%.
- Country demand projections use population scaling from 2020 baselines and do not endogenize economic/industrial relocation or policy-driven shifts.
Related Publications
Explore these studies to deepen your understanding of the subject.